
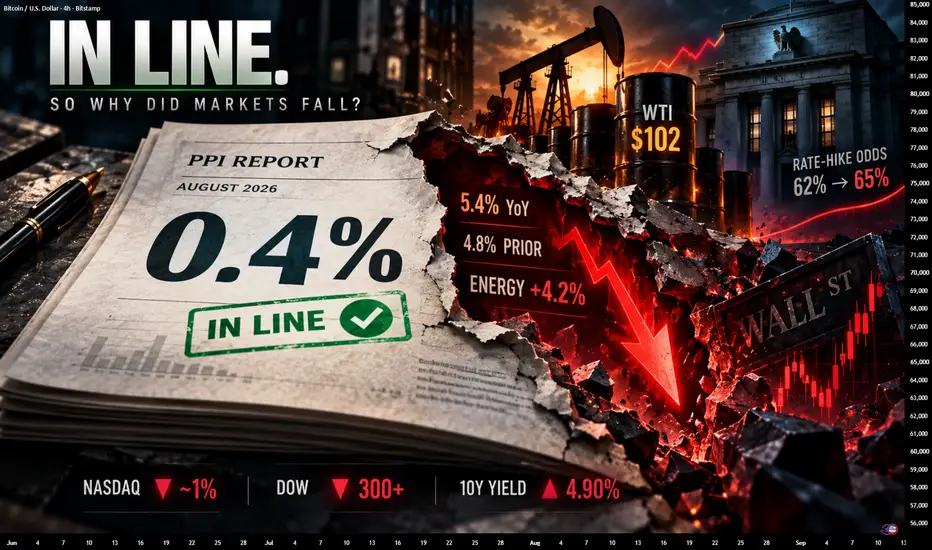
On September 10, 2026, the headline news was exactly where economists expected it to be, but the market didn't take it as a relief. Producer prices rose a modest 0.4 percent month over month in August, right in the center of what the consensus expected. By all standards, this should've been a relatively dull number. Instead, the Dow fell over 300 points, the Nasdaq dropped almost one percent, and this marked the fourth straight day of losses in major indices.
What could've happened to turn an allegedly in-line prediction of economists into a market fall, and why can " in line" sometimes be misleading? This article will describe what exactly happened with the report, and why this in-line scenario didn't turn out to be as good for the market as it was expected to be.
What happened to the PPI report
The Producer Price Index measures the rate of price increases for businesses before their prices are passed on to consumers. In the case of the monthly producer prices, the number for August was a meager 0.4 percent, right in line with what economists had predicted almost exactly.
However, another number that came with the report told a slightly different story. In year-over-year comparisons, producer prices have accelerated to 5.4 percent, up from 4.8 percent in the previous month. It's this jump that has spooked traders, as a single month of in-line predictions in the middle of a growing year-over-year trend is a more worrying sign than anything.
Within the PPI report itself, one particular segment saw the price increase jump by a whopping 4.2 percent - energy prices.
The oil price problem was on top of the inflation data
The day on which this report was released coincided with the day on which the US crude oil prices crossed above 100 dollars a barrel, with the ongoing conflict between the US and Iran entering its eighth month. The West Texas Intermediate crude oil jumped almost 7 percent on the day, settling just above 102 dollars, with Brent crude oil closing at a record high near 108 dollars.
Since the start of the conflict, the price of WTI crude oil has climbed by over 50 percent from where it was on the day of its start, with the annual increase standing close to 79 percent. A jump in one of the most important costs for the whole economy is a worrying sign, and it landed right on top of a report showing a year-over-year acceleration in the rate of producer prices.
How is the combination of the two significant?
Going into the details, a rise in the price of oil doesn't impact just the gas price at the pump - it also makes transportation more expensive, and by extension, more expensive to manufacture and sell products. The combination of a report showing accelerating year-over-year price increases in producer prices, and a jump in one of the input costs is an alarming sign that the situation is likely to get worse, rather than improve.
It impacts the expectations held by the market for what the Federal Reserve is likely to do next. Coming into the report, the market already held a roughly 62 percent chance of an interest rate hike at the Federal Reserve at its September meeting. The combined report data and oil spike caused the probability to climb to roughly 65 percent, with traders expecting the possibility to climb even higher depending on what the following day's Consumer Price Index report says.
Why did it particularly affect expensive growth stocks?
Unlike the Dow Jones Average, the Nasdaq composite index fell by almost a full percentage point, compared to the Dow's mere 0.5 percent slide. It wasn't a coincidence, as the expensive growth stocks that comprise a majority of the Nasdaq composite index are most sensitive to the expectations of future profitability. A report that causes the future discount rate to rise is particularly impactful on their prices, with the valuation multiples taking the biggest hit.
The chip stocks in particular felt the brunt of the pain - Intel fell by over 5 percent and Micron by almost 5 percent - as the investors worried that a combination of rising interest rates and rising crude oil prices would reduce the rate of economic growth, which in turn would hurt the demand for the chips these companies make.
The most important takeaway: single data points are rarely what moves the market
It's this kind of scenario that often highlights one of the most overlooked aspects behind reading the releases. A single data point that falls right on the expected mark sounds like a confirmation that everything is under control, and the market is likely to move on without a hiccup. However, it's always a good idea to remember that the more useful information is often hidden one step below the surface, either in the year-over-year statistics in the same report or a different market moving sharply at a similar time.
The bond market was also a good indicator when it came to understanding what was going on. The 10-year yield climbed to 4.90 percent, continuing an overall run towards higher multi-year highs, which occurred alongside - not despite - the headline PPI number in line with expectations. The bond market was doing what the equity market did: reacting to the same signals coming out of the report and the simultaneous spike in the prices of crude oil as a representative of a growing set of input costs.
How can you read a report like this correctly?
Don't just look at the monthly price change, but also the year-over-year one in the same report. The year-over-year statistics for a report that's released on a monthly basis are usually more important than the comparison to the previous month.
Look out for the developments in the commodity markets at the same time as the report is released. An inflation report that comes during a spike in the price of oil or another important input cost is going to influence the market differently than one that comes out during a period of relative calm.
Be aware of the changes in the probability of rate hikes or cuts right after a report is released. Not just the movement of the equity markets, but also the bonds' reaction can tell you what the market has concluded on the matter.
Remember that expensive growth stocks and value stocks usually have different reactions to the same type of news. A report that causes the value stock index to fall less than the growth one is a sign that the market is updating its expectations.
My Conclusion
An in-line report is usually taken by the market as a neutral surprise, but the experience of September 10, 2026 shows that it rarely has as little impact as one would expect on the following day's trading. The market doesn't just look at a single month of statistics, but also the trend throughout the year in year-over-year comparisons, and the simultaneous spike in the price of one of the most important input costs in the economy serves as confirmation that the trend is indeed likely to continue.
Thank You
VertexQore

Related publications
Disclaimer
The information and publications are not meant to be, and do not constitute, financial, investment, trading, or other types of advice or recommendations supplied or endorsed by TradingView. Read more in the Terms of Use.
Related publications
Disclaimer
The information and publications are not meant to be, and do not constitute, financial, investment, trading, or other types of advice or recommendations supplied or endorsed by TradingView. Read more in the Terms of Use.