
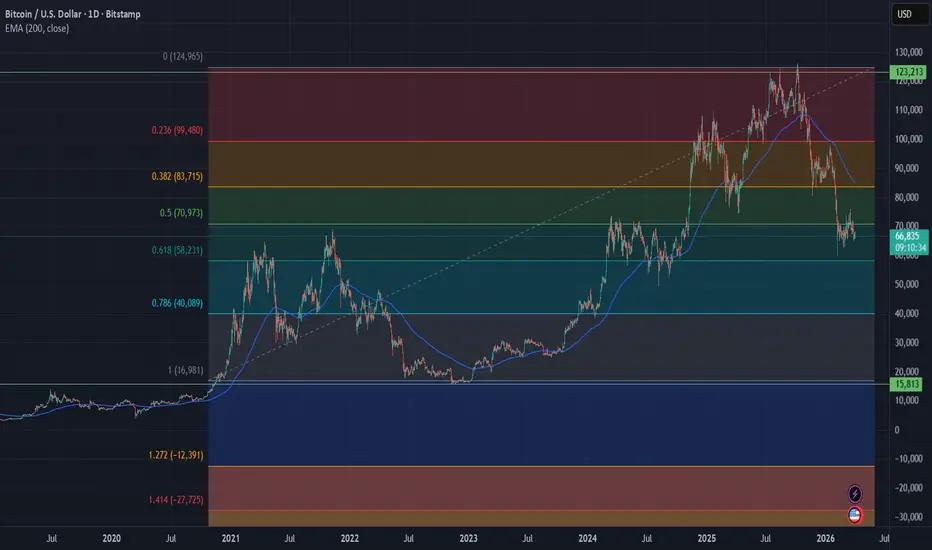
Current price: 67.5k
Macro Structure (3M + Monthly)
The correction is currently testing the institutional Fibonacci zone:
• 0.5 = 70.9k
• 0.618 = 58.2k
• 0.786 = 40k
Weekly Structure (Swing Trader’s Chart)- The key level here is 60k–62k
Daily Structure (Immediate Next Move)
Short-term price is consolidating after a sharp drop.
This often leads to either:
• a relief rally
• one final liquidity sweep lower
EMA + Dynamic Resistance
The 200 EMA is above price near 85–90k
Fibonacci + Confluence Zone
BTC is currently between:
0.5 fib = 70.9k
0.618 fib = 58.2k
Scenario A — Highest Probability (50%)
BTC makes one more sweep toward 60k / 58k, traps bears, then rebounds.
Likely path
Scenario B — Bullish Immediate Bounce (30%)
If BTC reclaims 71k on daily close
Then downside sweep may already be done.
Scenario C — Bearish Breakdown (15%)
If BTC closes below 58k
Disclaimer:
This analysis is based on technical chart patterns, multi-timeframe structure, Fibonacci levels, EMA trends, and the current market scenario. It reflects a probability-based view, not a certainty or financial advice. Crypto markets are highly volatile and can move sharply due to macroeconomic events, ETF flows, regulations, geopolitical news, and sudden liquidity shifts.
Macro Structure (3M + Monthly)
The correction is currently testing the institutional Fibonacci zone:
• 0.5 = 70.9k
• 0.618 = 58.2k
• 0.786 = 40k
Weekly Structure (Swing Trader’s Chart)- The key level here is 60k–62k
Daily Structure (Immediate Next Move)
Short-term price is consolidating after a sharp drop.
This often leads to either:
• a relief rally
• one final liquidity sweep lower
EMA + Dynamic Resistance
The 200 EMA is above price near 85–90k
Fibonacci + Confluence Zone
BTC is currently between:
0.5 fib = 70.9k
0.618 fib = 58.2k
Scenario A — Highest Probability (50%)
BTC makes one more sweep toward 60k / 58k, traps bears, then rebounds.
Likely path
Scenario B — Bullish Immediate Bounce (30%)
If BTC reclaims 71k on daily close
Then downside sweep may already be done.
Scenario C — Bearish Breakdown (15%)
If BTC closes below 58k
Disclaimer:
This analysis is based on technical chart patterns, multi-timeframe structure, Fibonacci levels, EMA trends, and the current market scenario. It reflects a probability-based view, not a certainty or financial advice. Crypto markets are highly volatile and can move sharply due to macroeconomic events, ETF flows, regulations, geopolitical news, and sudden liquidity shifts.

Disclaimer
The information and publications are not meant to be, and do not constitute, financial, investment, trading, or other types of advice or recommendations supplied or endorsed by TradingView. Read more in the Terms of Use.
Disclaimer
The information and publications are not meant to be, and do not constitute, financial, investment, trading, or other types of advice or recommendations supplied or endorsed by TradingView. Read more in the Terms of Use.