
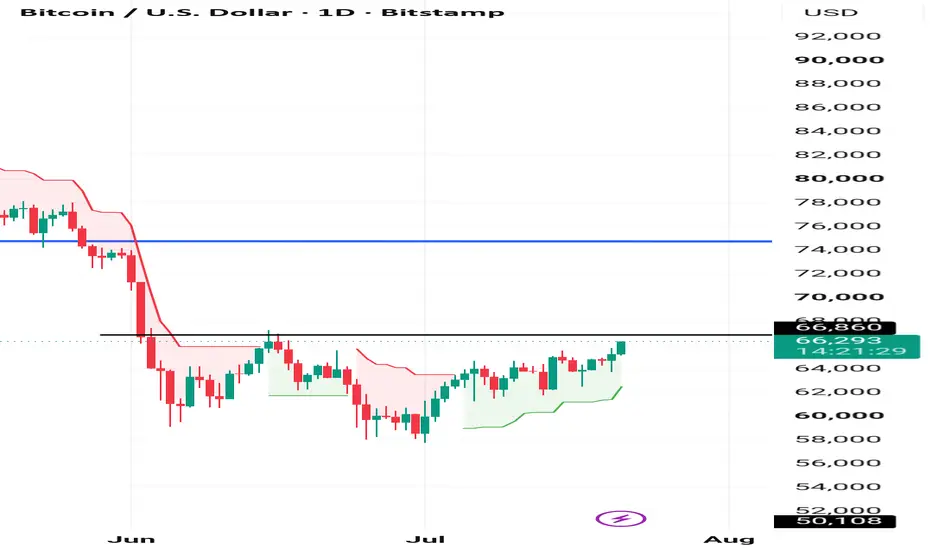
Bitcoin (BTCUSD) – Daily Chart Analysis
📈 Current Price: 66,283
📊 Trend
Short-term trend is bullish.
Price is trading above the Supertrend, indicating buyers are in control.
BTC is making Higher Highs and Higher Lows, which is a positive sign.
🔑 Key Levels
🟢 Support
64,000–65,000 – Immediate support
61,000–62,000 – Strong support
50,100 – Major long-term support
🔴 Resistance
66,860 – Immediate resistance (currently testing)
74,000 – Major breakout level
107,631 – Long-term resistance
📈 Bullish Scenario
A daily close above 66,860 could push BTC toward 70,000–74,000.
A breakout above 74,000 may start the next major bullish leg.
📉 Bearish Scenario
If BTC fails to hold above 64,000, it could decline toward 61,000–62,000.
A break below that zone may increase selling pressure.
🎯 Trading View
Buy Zone: 64,000–65,000 (after bullish confirmation)
Breakout Buy: Above 66,860 with strong volume
Stop Loss: Below 64,000 (for short-term trades)
Overall View:
Bitcoin is approaching a key resistance at 66,860. A confirmed breakout above this level could strengthen bullish momentum, while rejection may lead to a short-term pullback before the next move.
📈 Current Price: 66,283
📊 Trend
Short-term trend is bullish.
Price is trading above the Supertrend, indicating buyers are in control.
BTC is making Higher Highs and Higher Lows, which is a positive sign.
🔑 Key Levels
🟢 Support
64,000–65,000 – Immediate support
61,000–62,000 – Strong support
50,100 – Major long-term support
🔴 Resistance
66,860 – Immediate resistance (currently testing)
74,000 – Major breakout level
107,631 – Long-term resistance
📈 Bullish Scenario
A daily close above 66,860 could push BTC toward 70,000–74,000.
A breakout above 74,000 may start the next major bullish leg.
📉 Bearish Scenario
If BTC fails to hold above 64,000, it could decline toward 61,000–62,000.
A break below that zone may increase selling pressure.
🎯 Trading View
Buy Zone: 64,000–65,000 (after bullish confirmation)
Breakout Buy: Above 66,860 with strong volume
Stop Loss: Below 64,000 (for short-term trades)
Overall View:
Bitcoin is approaching a key resistance at 66,860. A confirmed breakout above this level could strengthen bullish momentum, while rejection may lead to a short-term pullback before the next move.

Disclaimer
The information and publications are not meant to be, and do not constitute, financial, investment, trading, or other types of advice or recommendations supplied or endorsed by TradingView. Read more in the Terms of Use.
Disclaimer
The information and publications are not meant to be, and do not constitute, financial, investment, trading, or other types of advice or recommendations supplied or endorsed by TradingView. Read more in the Terms of Use.