
Key Support and Resistance Levels
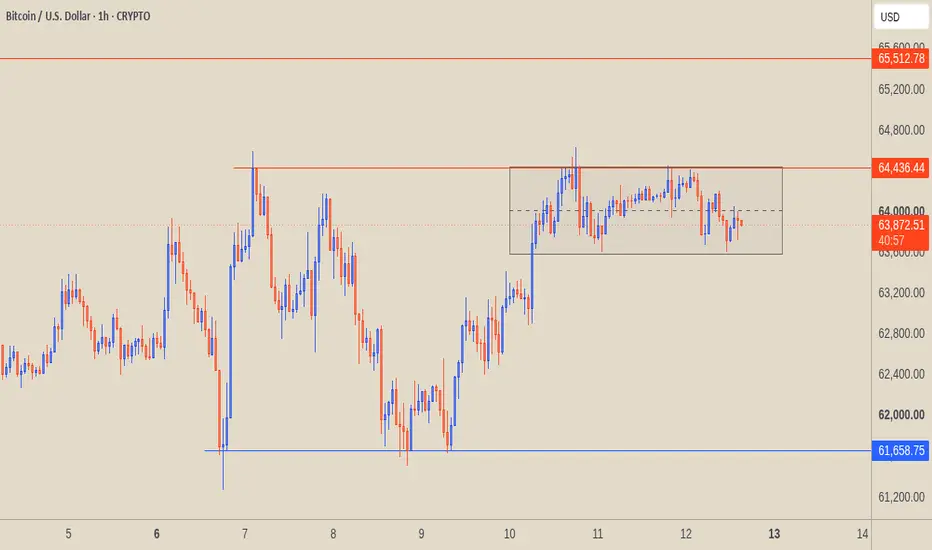
Major Support (Blue Line - 61,658.75): This is a critical structural low. The price saw a sharp rejection (long lower wick) at this level around the 6th/7th, establishing it as a strong demand zone. A subsequent higher low formed around the 9th, confirming this blue line as the foundational support for the current market structure.
Immediate Resistance (Lower Red Line - 64,436.44): This level previously acted as a local top. The price rallied aggressively from the lows to test this pivot, but was rejected, turning this line into a clear ceiling for the current price action.
Major Target Resistance (Upper Red Line - 65,512.78): If the bullish structure continues and breaks current resistance, this upper pivot serves as the next major structural target and liquidity zone.
Consolidation Box Analysis
The shaded rectangle highlights a distinct period of range-bound price action following the recent impulsive move upward.
Range Dynamics: The market is currently in a "choppy" sideways phase, digesting the recent gains. The box maps the boundaries of this consolidation, with the top anchored precisely at the 64,436.44 resistance level and the bottom near 63,600.00.
Equilibrium (Dashed Midline): The dashed line in the center of the box (around 64,000) represents the mean of this value area.
Current Price Action: The price (63,872.07) is currently hovering just below this dashed midline. This indicates slight local weakness within the range, as bears are defending the upper half of the box, pushing the price toward the lower boundary.
Structural Outlook
The current structure is a classic consolidation pattern following a strong bounce from major support. The next directional bias depends heavily on how the price interacts with the boundaries of the drawn box:
Bullish Breakout Scenario: A decisive 1h candle close above the top of the box (64,436.44) would confirm a continuation of the bullish market structure. This would likely trigger upward momentum toward the next major pivot at 65,512.78.
Bearish Breakdown Scenario: If the price loses the bottom of the box (around 63,600.00), the consolidation fails. This would signal a deeper retracement, likely sweeping liquidity lower to test the mid-62,000s or eventually retesting the ultimate major support at 61,658.75.
Major Support (Blue Line - 61,658.75): This is a critical structural low. The price saw a sharp rejection (long lower wick) at this level around the 6th/7th, establishing it as a strong demand zone. A subsequent higher low formed around the 9th, confirming this blue line as the foundational support for the current market structure.
Immediate Resistance (Lower Red Line - 64,436.44): This level previously acted as a local top. The price rallied aggressively from the lows to test this pivot, but was rejected, turning this line into a clear ceiling for the current price action.
Major Target Resistance (Upper Red Line - 65,512.78): If the bullish structure continues and breaks current resistance, this upper pivot serves as the next major structural target and liquidity zone.
Consolidation Box Analysis
The shaded rectangle highlights a distinct period of range-bound price action following the recent impulsive move upward.
Range Dynamics: The market is currently in a "choppy" sideways phase, digesting the recent gains. The box maps the boundaries of this consolidation, with the top anchored precisely at the 64,436.44 resistance level and the bottom near 63,600.00.
Equilibrium (Dashed Midline): The dashed line in the center of the box (around 64,000) represents the mean of this value area.
Current Price Action: The price (63,872.07) is currently hovering just below this dashed midline. This indicates slight local weakness within the range, as bears are defending the upper half of the box, pushing the price toward the lower boundary.
Structural Outlook
The current structure is a classic consolidation pattern following a strong bounce from major support. The next directional bias depends heavily on how the price interacts with the boundaries of the drawn box:
Bullish Breakout Scenario: A decisive 1h candle close above the top of the box (64,436.44) would confirm a continuation of the bullish market structure. This would likely trigger upward momentum toward the next major pivot at 65,512.78.
Bearish Breakdown Scenario: If the price loses the bottom of the box (around 63,600.00), the consolidation fails. This would signal a deeper retracement, likely sweeping liquidity lower to test the mid-62,000s or eventually retesting the ultimate major support at 61,658.75.
Trade active
Bearish Breakdown ConfirmedPrevious View Recap
In the previous analysis, the market was consolidating tightly within the 63,600 – 64,436 box. The specific warning for a bearish breakdown scenario was:
"If the price loses the bottom of the box (around 63,600.00), the consolidation fails. This would signal a deeper retracement, likely sweeping liquidity lower to test the mid-62,000s..."
Current Price Action & Breakdown Analysis
The Breakdown: As seen on the updated chart, the consolidation range has officially failed. Bears aggressively defended the top of the box (64,436.44), leading to a decisive breakdown below the 63,600 support level.
Momentum: The drop was fast and impulsive, characterized by consecutive large bearish candles slicing straight through local demand.
Current Price: The market is trading at 62,677.31, successfully hitting the predicted mid-62,000s liquidity zone.
Forward Outlook & Key Levels to Watch
Immediate Lower Target / Major Support (Blue Line - 61,658.75):
Since the mid-62,000s area is currently being tested, this is the first spot where buyers might attempt to form a temporary base. However, if selling pressure persists, the structural magnet remains the ultimate major support at 61,658.75 (the previous major ZigZag swing low).
New Immediate Resistance (The Box Bottom - 63,600.00):
Any relief rallies from the current levels will now face heavy overhead resistance. The previous floor of the consolidation box (63,600) will now act as a classic support-turned-resistance flip. Bears will likely look to short any weak retests of this zone.
Trading Strategy Context
The bears are firmly in control of the lower-timeframe trend right now. A short-term bounce to retest the broken range around 63,600 could offer a potential risk-defined entry for short positions targeting the major blue support line. Aggressive buying should be avoided until a clear higher low or a strong demand rejection print forms near the key support levels below.

Disclaimer
The information and publications are not meant to be, and do not constitute, financial, investment, trading, or other types of advice or recommendations supplied or endorsed by TradingView. Read more in the Terms of Use.
Disclaimer
The information and publications are not meant to be, and do not constitute, financial, investment, trading, or other types of advice or recommendations supplied or endorsed by TradingView. Read more in the Terms of Use.