
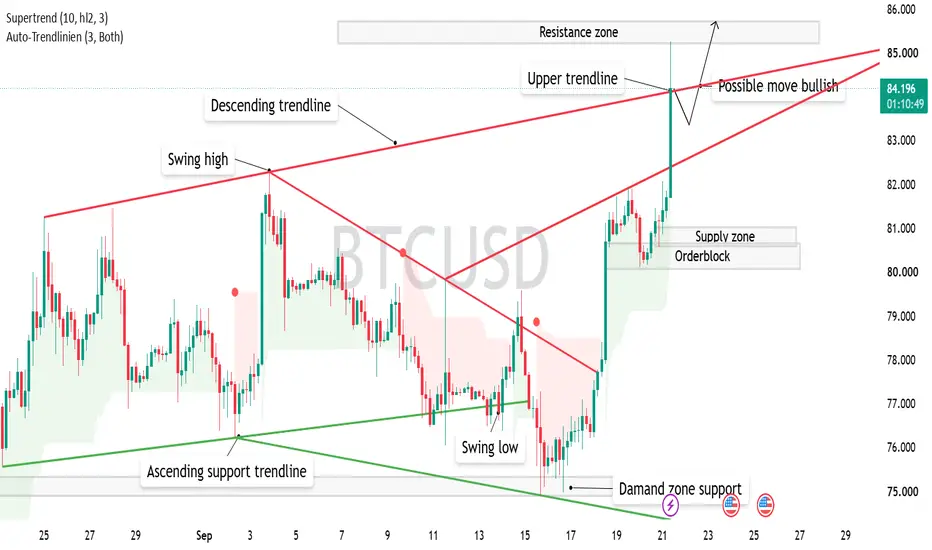
📊 BTC/USD – Technische Analyse 🇩🇪
Aktueller Kurs: ca. 84.237 USD
Marktstruktur: 🟢 Bullischer Ausbruchsversuch
🔺 Trend: BTC hat die fallende Trendlinie nach oben durchbrochen – positives Momentum.
🟢 Support: Der Bereich 80.000–81.000 USD dient als wichtige Orderblock-/Support-Zone.
🎯 Widerstand: Die zentrale Resistance-Zone liegt bei etwa 85.300–85.700 USD.
🚀 Bullishes Szenario: Ein bestätigter Ausbruch über die obere Trendlinie könnte einen Anstieg Richtung 85.500–86.000 USD ermöglichen.
⚠️ Risiko: Fällt BTC wieder unter die Breakout-Zone, wäre ein Rücklauf in Richtung 81.000–80.000 USD möglich.
Bias: 📈 Bullisch, solange BTC die Breakout- und Support-Struktur hält.
Trade closed: target reached
🎯 BTC/USD – Ziel erfolgreich erreicht! 🚀
Das bullische Setup ist wie erwartet aufgegangen. BTC hat sich dynamisch in Richtung der prognostizierten Widerstandszone bewegt. 📈
✅ Ziel erreicht
🔥 Breakout bestätigt
💪 Starkes bullisches Momentum
Setup erfolgreich abgeschlossen. 🎯📊

Related publications
Disclaimer
The information and publications are not meant to be, and do not constitute, financial, investment, trading, or other types of advice or recommendations supplied or endorsed by TradingView. Read more in the Terms of Use.
Related publications
Disclaimer
The information and publications are not meant to be, and do not constitute, financial, investment, trading, or other types of advice or recommendations supplied or endorsed by TradingView. Read more in the Terms of Use.