
Bitcoin's Blockchain Is a Public Ledger. It Tells You What Holders Are Doing Before Price Tells You.
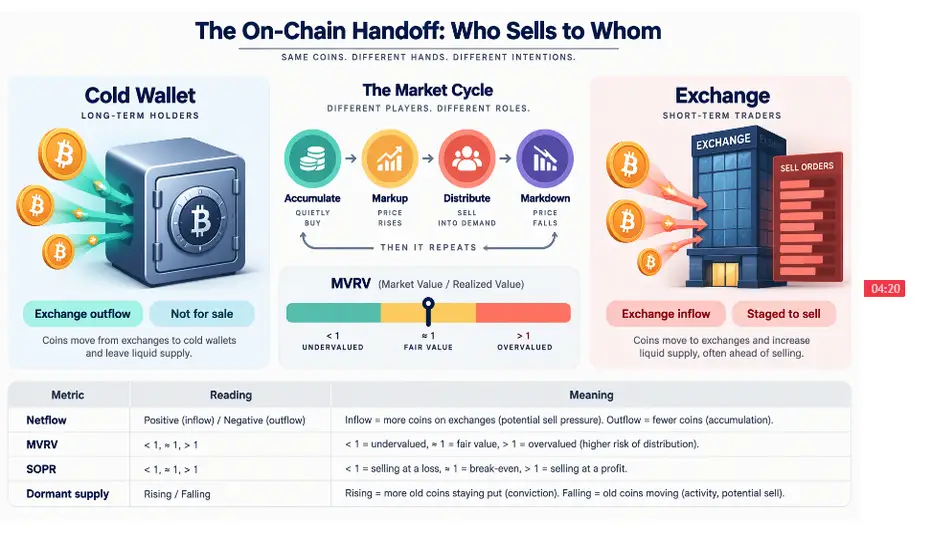
Exchange netflow, MVRV, SOPR and dormant supply are not indicators. They are direct observations of behaviour.
Why On-Chain Data Is Different
A moving average is derived from price. Price is derived from orders. On-chain data is derived from wallet movements — a completely independent information channel. That is why it can lead price: coins moving onto an exchange are inventory being staged for a potential sale.
The Four Metrics Worth Understanding
- Exchange netflow = coins in minus coins out. Net inflow = supply moving toward sellable inventory. Net outflow = supply moving into self-custody, i.e. not for sale today.
- MVRV (Market Value / Realized Value): compares current price to the average price at which every coin last moved. Well above 1 = the average holder is in profit and has room to distribute. Near or below 1 = the average holder is at a loss; historically this marks capitulation zones.
- SOPR (Spent Output Profit Ratio): are coins being spent at a profit or a loss? SOPR above 1 with price rising = healthy. SOPR pinned near 1.0 on rallies = profit-taking pressure at every level.
- Dormant supply / coin days destroyed: coins untouched for years moving means old holders are distributing. It is the clearest "smart money selling to FOMO" signal available.
The Cycle Handoff Map
- Accumulation — Netflow: Outflows rising | MVRV: Near 1.0 | Who buys: Long-term holders
- Markup — Netflow: Mixed | MVRV: 1.5–2.5 | Who buys: Early retail, institutions
- Distribution — Netflow: Heavy inflows | MVRV: Above 3 | Who buys: Late retail
- Markdown — Netflow: Outflows resume | MVRV: Back toward 1 | Who buys: Contrarians
The Honest Caveats
- Exchange addresses are estimated, not known. Custodial and ETF wrappers complicate this enormously now — ETF custody coins can look like exchange holdings without being sellable inventory.
- Coin consolidation, internal shuffles, and mixing create false signals.
- On-chain metrics describe average holder behaviour. Averages do not stop a demand shock like an ETF approval week.
- These metrics have no short-term timing value. They are cycle and position-sizing tools, not entry tools.
Treat on-chain data as the context layer that tells you how aggressive to be. Let price structure tell you when.
Educational content only. Not investment advice. On-chain metrics are estimates and can be misleading.
Note
TradingView SetupCRYPTO:BTCUSD daily plus weekly.
Community indicators: search "MVRV", "SOPR", "Exchange Netflow" in the indicators library — several free versions plot these directly on the chart.
For deeper data, use a dedicated on-chain analytics platform alongside, and keep TradingView for execution and structure.
Alert idea: BTC weekly close below realized-price proxy while exchange inflows spike — that combination has historically marked the transition from bull to bear structure.

Disclaimer
The information and publications are not meant to be, and do not constitute, financial, investment, trading, or other types of advice or recommendations supplied or endorsed by TradingView. Read more in the Terms of Use.
Disclaimer
The information and publications are not meant to be, and do not constitute, financial, investment, trading, or other types of advice or recommendations supplied or endorsed by TradingView. Read more in the Terms of Use.