
## **Market Overview**
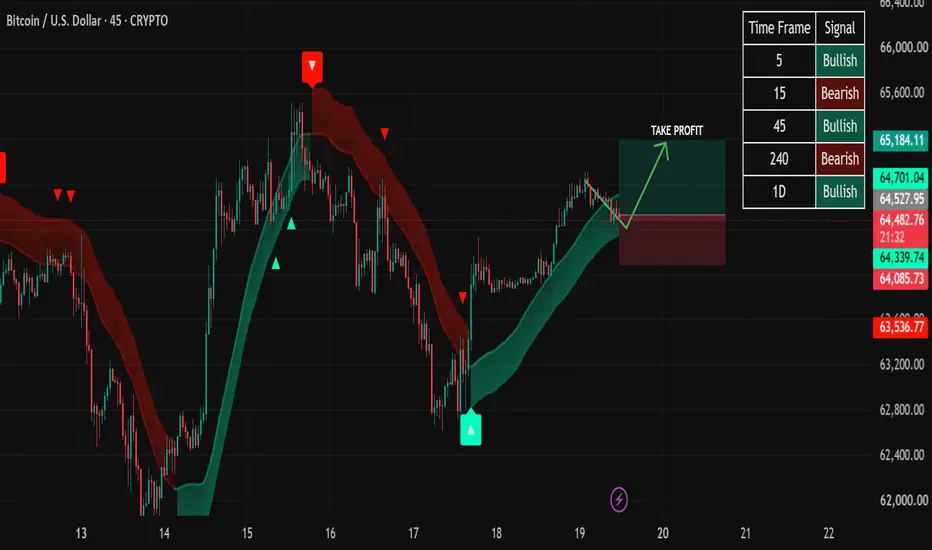
The BTC/USD 45-minute chart is showing a **short-term bullish structure** following a strong recovery from the recent swing low around **62,700**. Price has transitioned from a bearish trend into a higher-low formation, supported by a rising dynamic trend band (green cloud), indicating that buyers currently have the advantage.
At the time of the chart:
* **Current Price:** 64,505.95
* **Trend Bias:** Bullish (45M)
* **Immediate Resistance:** 64,700–65,200
* **Major Support:** 64,340–64,100
---
## **Trend Analysis**
The market has successfully shifted from a prolonged bearish phase (red trend band) into a bullish environment (green trend band).
Key observations:
* Price remains **above the dynamic support zone**, confirming short-term buying pressure.
* The trend indicator has maintained its bullish color, suggesting momentum remains positive.
* The recent pullback appears healthy rather than a trend reversal.
**Trend Strength:** ★★★★☆ (4/5)
---
## **Multi-Timeframe Confirmation**
| Timeframe | Signal | Interpretation |
| --------- | ---------- | ---------------------------------------- |
| 5 Min | 🟢 Bullish | Strong short-term momentum |
| 15 Min | 🔴 Bearish | Minor correction underway |
| 45 Min | 🟢 Bullish | Primary intraday trend remains positive |
| 4 Hour | 🔴 Bearish | Higher timeframe resistance still exists |
| Daily | 🟢 Bullish | Long-term trend remains constructive |
### Interpretation
This mixed alignment suggests:
* Short-term traders may experience volatility.
* The 45-minute and Daily charts favor continuation higher.
* The 4-hour bearish bias warns that upside may face resistance before a larger breakout.
---
# **Price Structure**
### Higher Low Formation
The recent retracement failed to create a lower low, indicating buyers are defending higher prices.
This is typically a bullish continuation characteristic.
Current sequence:
* Higher Low ✅
* Higher High Attempt ✅
* Trend Support Holding ✅
---
# **Support & Resistance**
### Support Levels
* **64,340** – Dynamic trend support
* **64,100** – Strong horizontal support
* **63,536** – Major structural support
### Resistance Levels
* **64,700** – Immediate resistance
* **65,180** – First upside objective
* **65,600** – Previous swing high
A confirmed break above **64,700** would significantly improve the probability of reaching the next resistance zone.
---
# **Momentum Analysis**
Momentum remains positive despite the recent pullback.
Signs supporting buyers include:
* Rising trend support
* Price respecting the moving trend channel
* No confirmed bearish structure break
* Buyers stepping in after minor declines
However, volume confirmation would strengthen the bullish case.
---
# **Trade Scenario**
### Bullish Setup (Higher Probability)
**Entry Zone**
* 64,450–64,550
**Stop Loss**
* Below 64,100
**Target 1**
* 64,700
**Target 2**
* 65,180
**Target 3**
* 65,600
This setup offers a favorable risk-to-reward profile if price continues to respect the rising support.
---
### Bearish Risk Scenario
The bullish outlook would weaken if:
* Price closes below **64,100**
* The green trend support flips bearish
* Lower highs begin forming beneath resistance
In that case, downside targets could extend toward **63,800–63,500**.
---
# **Professional Outlook**
The chart currently favors a **bullish continuation** as long as price remains above the dynamic support around **64,340–64,100**. Although the 4-hour timeframe still reflects broader resistance, the 45-minute structure is constructive, with buyers maintaining control after a healthy pullback.
A decisive breakout above **64,700** would likely open the path toward **65,180–65,600**, while a loss of **64,100** would invalidate the immediate bullish setup and increase the probability of a deeper correction.
### **Overall Bias**
* **Trend:** Bullish
* **Momentum:** Moderately Strong
* **Market Structure:** Bullish Continuation
* **Risk Level:** Moderate (due to mixed higher-timeframe signals)
* **Probability:** **65–70% Bullish Continuation**, provided support around **64,100** holds.
The BTC/USD 45-minute chart is showing a **short-term bullish structure** following a strong recovery from the recent swing low around **62,700**. Price has transitioned from a bearish trend into a higher-low formation, supported by a rising dynamic trend band (green cloud), indicating that buyers currently have the advantage.
At the time of the chart:
* **Current Price:** 64,505.95
* **Trend Bias:** Bullish (45M)
* **Immediate Resistance:** 64,700–65,200
* **Major Support:** 64,340–64,100
---
## **Trend Analysis**
The market has successfully shifted from a prolonged bearish phase (red trend band) into a bullish environment (green trend band).
Key observations:
* Price remains **above the dynamic support zone**, confirming short-term buying pressure.
* The trend indicator has maintained its bullish color, suggesting momentum remains positive.
* The recent pullback appears healthy rather than a trend reversal.
**Trend Strength:** ★★★★☆ (4/5)
---
## **Multi-Timeframe Confirmation**
| Timeframe | Signal | Interpretation |
| --------- | ---------- | ---------------------------------------- |
| 5 Min | 🟢 Bullish | Strong short-term momentum |
| 15 Min | 🔴 Bearish | Minor correction underway |
| 45 Min | 🟢 Bullish | Primary intraday trend remains positive |
| 4 Hour | 🔴 Bearish | Higher timeframe resistance still exists |
| Daily | 🟢 Bullish | Long-term trend remains constructive |
### Interpretation
This mixed alignment suggests:
* Short-term traders may experience volatility.
* The 45-minute and Daily charts favor continuation higher.
* The 4-hour bearish bias warns that upside may face resistance before a larger breakout.
---
# **Price Structure**
### Higher Low Formation
The recent retracement failed to create a lower low, indicating buyers are defending higher prices.
This is typically a bullish continuation characteristic.
Current sequence:
* Higher Low ✅
* Higher High Attempt ✅
* Trend Support Holding ✅
---
# **Support & Resistance**
### Support Levels
* **64,340** – Dynamic trend support
* **64,100** – Strong horizontal support
* **63,536** – Major structural support
### Resistance Levels
* **64,700** – Immediate resistance
* **65,180** – First upside objective
* **65,600** – Previous swing high
A confirmed break above **64,700** would significantly improve the probability of reaching the next resistance zone.
---
# **Momentum Analysis**
Momentum remains positive despite the recent pullback.
Signs supporting buyers include:
* Rising trend support
* Price respecting the moving trend channel
* No confirmed bearish structure break
* Buyers stepping in after minor declines
However, volume confirmation would strengthen the bullish case.
---
# **Trade Scenario**
### Bullish Setup (Higher Probability)
**Entry Zone**
* 64,450–64,550
**Stop Loss**
* Below 64,100
**Target 1**
* 64,700
**Target 2**
* 65,180
**Target 3**
* 65,600
This setup offers a favorable risk-to-reward profile if price continues to respect the rising support.
---
### Bearish Risk Scenario
The bullish outlook would weaken if:
* Price closes below **64,100**
* The green trend support flips bearish
* Lower highs begin forming beneath resistance
In that case, downside targets could extend toward **63,800–63,500**.
---
# **Professional Outlook**
The chart currently favors a **bullish continuation** as long as price remains above the dynamic support around **64,340–64,100**. Although the 4-hour timeframe still reflects broader resistance, the 45-minute structure is constructive, with buyers maintaining control after a healthy pullback.
A decisive breakout above **64,700** would likely open the path toward **65,180–65,600**, while a loss of **64,100** would invalidate the immediate bullish setup and increase the probability of a deeper correction.
### **Overall Bias**
* **Trend:** Bullish
* **Momentum:** Moderately Strong
* **Market Structure:** Bullish Continuation
* **Risk Level:** Moderate (due to mixed higher-timeframe signals)
* **Probability:** **65–70% Bullish Continuation**, provided support around **64,100** holds.

Disclaimer
The information and publications are not meant to be, and do not constitute, financial, investment, trading, or other types of advice or recommendations supplied or endorsed by TradingView. Read more in the Terms of Use.
Disclaimer
The information and publications are not meant to be, and do not constitute, financial, investment, trading, or other types of advice or recommendations supplied or endorsed by TradingView. Read more in the Terms of Use.