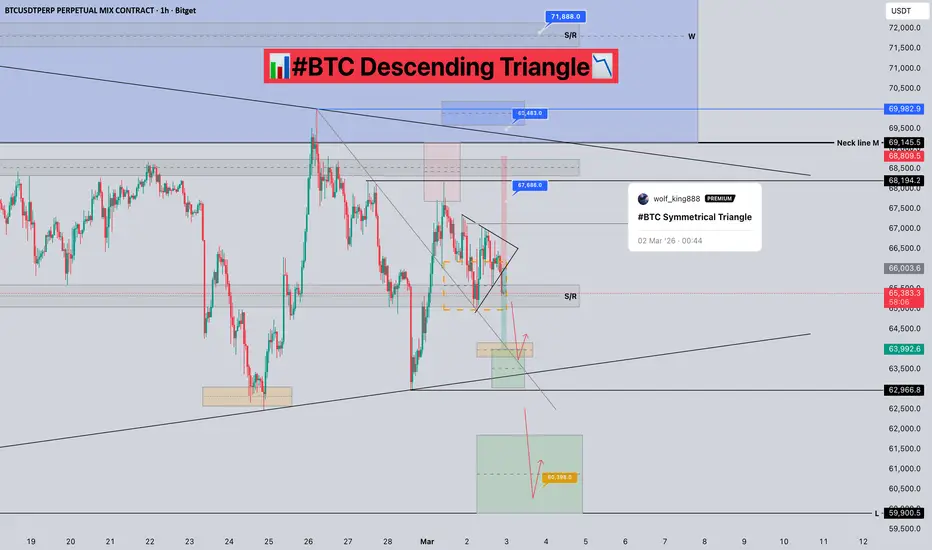
📊#BTC Descending Triangle📉
🧠From a structural perspective, we stabilized above the S/R level around 65000. Although the support level was reached, the rebound wasn't strong, so I closed all my long positions here earlier, effectively escaping at the highest point.
➡️As time went on, the support gradually weakened, and the price compressed, forming a descending triangle. It has now broken below the lower edge of the triangle, so there's a probability of further declines.
➡️With the escalating conflict in the Middle East, the oil and gold markets are surging, indicating that the conflict will likely intensify. This could act as a catalyst, pushing the market to test extreme support levels (57777-60398). We need to be wary of this possibility!
⚠️In a rapidly volatile market, especially during a bear market, we shouldn't be overly optimistic. Risk management is crucial! Survival is key to seizing more opportunities!
🤜If you like my analysis, please like 💖 and share 💬

 BTCUSDT.P
🧠From a structural perspective, we stabilized above the S/R level around 65000. Although the support level was reached, the rebound wasn't strong, so I closed all my long positions here earlier, effectively escaping at the highest point.
➡️As time went on, the support gradually weakened, and the price compressed, forming a descending triangle. It has now broken below the lower edge of the triangle, so there's a probability of further declines.
➡️With the escalating conflict in the Middle East, the oil and gold markets are surging, indicating that the conflict will likely intensify. This could act as a catalyst, pushing the market to test extreme support levels (57777-60398). We need to be wary of this possibility!
⚠️In a rapidly volatile market, especially during a bear market, we shouldn't be overly optimistic. Risk management is crucial! Survival is key to seizing more opportunities!
🤜If you like my analysis, please like 💖 and share 💬
BTCUSDT.P Trade closed manually
#BTC
After reducing holdings by 50% near 65300, the order was automatically closed upon the rebound reaching the cost price.
The expected further decline did not occur; we held the support near 65000.
Next, we need to watch the resistance levels near 69588 and 72000!

💎Use WolfKing's exclusive invitation code to trade and gain VIP subscription access.
🔗 BITGET 👉wolf20👇
partner.bitget.fit/bg/wolfking20
🔗 BYBIT 👉WOLFKING👇
partner.bybit.com/b/wolfking
🔗 Binance 👉O3D948JZ👇
🔗 BITGET 👉wolf20👇
partner.bitget.fit/bg/wolfking20
🔗 BYBIT 👉WOLFKING👇
partner.bybit.com/b/wolfking
🔗 Binance 👉O3D948JZ👇
Related publications
Disclaimer
The information and publications are not meant to be, and do not constitute, financial, investment, trading, or other types of advice or recommendations supplied or endorsed by TradingView. Read more in the Terms of Use.
💎Use WolfKing's exclusive invitation code to trade and gain VIP subscription access.
🔗 BITGET 👉wolf20👇
partner.bitget.fit/bg/wolfking20
🔗 BYBIT 👉WOLFKING👇
partner.bybit.com/b/wolfking
🔗 Binance 👉O3D948JZ👇
🔗 BITGET 👉wolf20👇
partner.bitget.fit/bg/wolfking20
🔗 BYBIT 👉WOLFKING👇
partner.bybit.com/b/wolfking
🔗 Binance 👉O3D948JZ👇
Related publications
Disclaimer
The information and publications are not meant to be, and do not constitute, financial, investment, trading, or other types of advice or recommendations supplied or endorsed by TradingView. Read more in the Terms of Use.