
Wyckoff Method: How Smart Money Accumulates & Distributes
Hook
Price ranges for weeks. You get bored, buy the breakout… and it reverses. 😤
That range wasn’t random. It was a campaign.
Smart money was quietly building a position while you were waiting for a signal. 🎯
Context: The Core Idea
Big players can’t buy or sell size in one click. It would move price against them.
So they work inside a range: accumulating after a downtrend, distributing after an uptrend.
Wyckoff called this Cause & Effect. The range is the cause. The trend that follows is the effect.
The cycle: Accumulation → Markup → Distribution → Markdown
1️⃣ Accumulation (Smart Money Buying)
After a downtrend, smart money quietly builds long positions inside a range. Price looks weak and boring, but supply is being absorbed.
2️⃣ Distribution (Smart Money Selling)
After an uptrend, smart money unloads into strength. Price looks strong, but demand is being used up.
Distribution mirrors accumulation: UTAD, SOW (Sign of Weakness), and LPSY (Last Point of Supply).
3️⃣ Spring (Shakeout Below Support)
A false break below support that traps sellers before the rally begins.
Price dips under the range low, triggers stops, then snaps back inside. A good spring recovers fast, followed by a Test on low volume that doesn’t make a new low.
4️⃣ Upthrust / UTAD (False Break Above)
The mirror of the spring. Price breaks above resistance, traps buyers, then drops back into the range.
5️⃣ SOS & LPS (Strength Confirmed)
SOS (Sign of Strength): a strong push that breaks resistance
LPS (Last Point of Support): the low-risk pullback entry that follows
6️⃣ Cause & Effect (Range = Fuel)
The longer the range builds, the bigger the move that follows. Wyckoff traders even project targets from the range height.
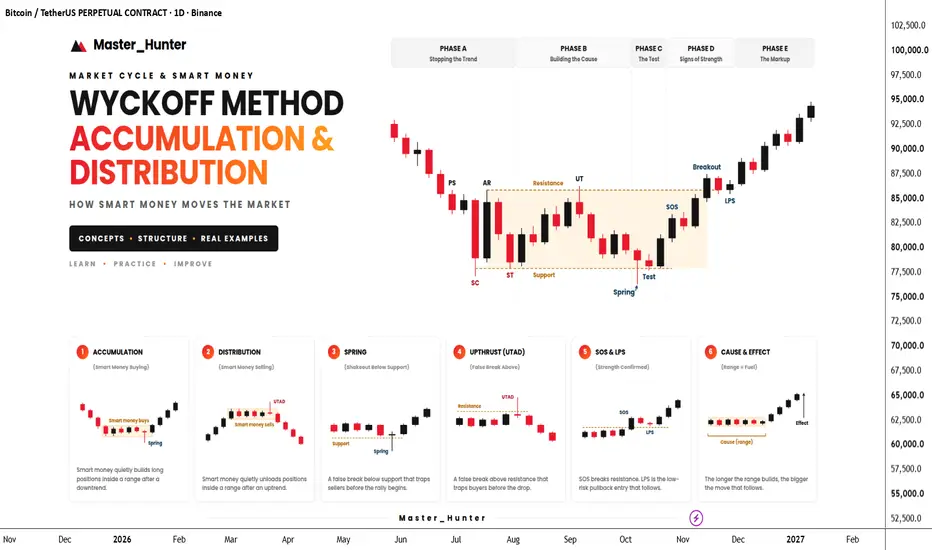
🔥 The 5 Phases (Chart Example)
Phase A: Stopping the Trend
Phase B: Building the Cause
Price chops between support and resistance. Smart money accumulates. Expect false breaks like a UT.
Phase C: The Test
The Spring shakes out weak hands, then a Test confirms supply is gone.
Phase D: Signs of Strength
SOS breaks resistance, then LPS prints a higher low.
Phase E: The Markup
Breakout, trend, and the effect of the cause.
PS → SC → AR → ST → UT → Spring → Test → SOS → LPS → Breakout
🎯 Execution Checklist
✅ Confirm a prior trend and a clear range (Phase A)
✅ Mark support and resistance from SC and AR
✅ Wait for Phase C: Spring (or UTAD) with a fast recovery
✅ Look for the Test on lower volume
✅ Enter on the LPS or the breakout retest, not on the first spike
✅ Stop below the LPS (or below the Spring low)
✅ Target the range projection and take partials
⚠️ Common Mistakes
📊 Illustrative Example (hypothetical, not a signal)
Accumulation after a downtrend. Range: 1.0800 support, 1.0900 resistance. Spring dips to 1.0785 and recovers. SOS breaks 1.0900, then LPS pulls back and holds.
Long entry (LPS): 1.0910
SL: 1.0860 (50 pips)
Risk 1% of a $10,000 account = $100 → 0.20 lot
Exit Price R:R Size
TP1 1.0985 1.5R 0.08 lot (40%)
TP2 1.1060 3R 0.06 lot (30%)
TP3 1.1160 5R 0.06 lot (30%)
If all targets hit, the blended result is 3R ($300). Move the stop to breakeven after TP1.
Final Thought
Ranges aren’t boring. They’re where the next trend is built. 🧠
Wait for the Spring, confirm with the Test, and enter on strength. Don’t buy the top of the range, and don’t sell the bottom.
💬 Which phase is hardest for you to spot: Spring, UTAD, or LPS? Tell me in the comments and I’ll break it down next!
If this helped, a 👍 and a follow go a long way.
Educational purposes only. Not financial advice.
Price ranges for weeks. You get bored, buy the breakout… and it reverses. 😤
That range wasn’t random. It was a campaign.
Smart money was quietly building a position while you were waiting for a signal. 🎯
Context: The Core Idea
Big players can’t buy or sell size in one click. It would move price against them.
So they work inside a range: accumulating after a downtrend, distributing after an uptrend.
Wyckoff called this Cause & Effect. The range is the cause. The trend that follows is the effect.
The cycle: Accumulation → Markup → Distribution → Markdown
1️⃣ Accumulation (Smart Money Buying)
After a downtrend, smart money quietly builds long positions inside a range. Price looks weak and boring, but supply is being absorbed.
2️⃣ Distribution (Smart Money Selling)
After an uptrend, smart money unloads into strength. Price looks strong, but demand is being used up.
Distribution mirrors accumulation: UTAD, SOW (Sign of Weakness), and LPSY (Last Point of Supply).
3️⃣ Spring (Shakeout Below Support)
A false break below support that traps sellers before the rally begins.
Price dips under the range low, triggers stops, then snaps back inside. A good spring recovers fast, followed by a Test on low volume that doesn’t make a new low.
4️⃣ Upthrust / UTAD (False Break Above)
The mirror of the spring. Price breaks above resistance, traps buyers, then drops back into the range.
5️⃣ SOS & LPS (Strength Confirmed)
SOS (Sign of Strength): a strong push that breaks resistance
LPS (Last Point of Support): the low-risk pullback entry that follows
6️⃣ Cause & Effect (Range = Fuel)
The longer the range builds, the bigger the move that follows. Wyckoff traders even project targets from the range height.
🔥 The 5 Phases (Chart Example)
Phase A: Stopping the Trend
- PS (Preliminary Support): first sign of buying
- SC (Selling Climax): panic selling on high volume
- AR (Automatic Rally): the bounce that sets resistance
- ST (Secondary Test): price retests the SC low
Phase B: Building the Cause
Price chops between support and resistance. Smart money accumulates. Expect false breaks like a UT.
Phase C: The Test
The Spring shakes out weak hands, then a Test confirms supply is gone.
Phase D: Signs of Strength
SOS breaks resistance, then LPS prints a higher low.
Phase E: The Markup
Breakout, trend, and the effect of the cause.
PS → SC → AR → ST → UT → Spring → Test → SOS → LPS → Breakout
🎯 Execution Checklist
✅ Confirm a prior trend and a clear range (Phase A)
✅ Mark support and resistance from SC and AR
✅ Wait for Phase C: Spring (or UTAD) with a fast recovery
✅ Look for the Test on lower volume
✅ Enter on the LPS or the breakout retest, not on the first spike
✅ Stop below the LPS (or below the Spring low)
✅ Target the range projection and take partials
⚠️ Common Mistakes
- Calling every range “accumulation” (you need a prior downtrend and Phase A)
- Buying before Phase C is complete
- Treating a spring as guaranteed. If price stays below support on strong volume, it’s a breakdown
- Ignoring volume (climax, test, SOS)
- Chasing the breakout instead of waiting for the LPS
- Exiting 100% at the first target
📊 Illustrative Example (hypothetical, not a signal)
Accumulation after a downtrend. Range: 1.0800 support, 1.0900 resistance. Spring dips to 1.0785 and recovers. SOS breaks 1.0900, then LPS pulls back and holds.
Long entry (LPS): 1.0910
SL: 1.0860 (50 pips)
Risk 1% of a $10,000 account = $100 → 0.20 lot
Exit Price R:R Size
TP1 1.0985 1.5R 0.08 lot (40%)
TP2 1.1060 3R 0.06 lot (30%)
TP3 1.1160 5R 0.06 lot (30%)
If all targets hit, the blended result is 3R ($300). Move the stop to breakeven after TP1.
Final Thought
Ranges aren’t boring. They’re where the next trend is built. 🧠
Wait for the Spring, confirm with the Test, and enter on strength. Don’t buy the top of the range, and don’t sell the bottom.
💬 Which phase is hardest for you to spot: Spring, UTAD, or LPS? Tell me in the comments and I’ll break it down next!
If this helped, a 👍 and a follow go a long way.
Educational purposes only. Not financial advice.

📉 Trading without a plan is gambling💸!?
NOT HERE‼️
Real entry, stop-loss & target — R:R tracked live ✅
🟢 Channel: t.me/MasterHunterAnalysis
🔵 X: x.com/Master_HunterX
🔴 Contact: t.me/MasterHunterTrade
NOT HERE‼️
Real entry, stop-loss & target — R:R tracked live ✅
🟢 Channel: t.me/MasterHunterAnalysis
🔵 X: x.com/Master_HunterX
🔴 Contact: t.me/MasterHunterTrade
Related publications
Disclaimer
The information and publications are not meant to be, and do not constitute, financial, investment, trading, or other types of advice or recommendations supplied or endorsed by TradingView. Read more in the Terms of Use.
📉 Trading without a plan is gambling💸!?
NOT HERE‼️
Real entry, stop-loss & target — R:R tracked live ✅
🟢 Channel: t.me/MasterHunterAnalysis
🔵 X: x.com/Master_HunterX
🔴 Contact: t.me/MasterHunterTrade
NOT HERE‼️
Real entry, stop-loss & target — R:R tracked live ✅
🟢 Channel: t.me/MasterHunterAnalysis
🔵 X: x.com/Master_HunterX
🔴 Contact: t.me/MasterHunterTrade
Related publications
Disclaimer
The information and publications are not meant to be, and do not constitute, financial, investment, trading, or other types of advice or recommendations supplied or endorsed by TradingView. Read more in the Terms of Use.