
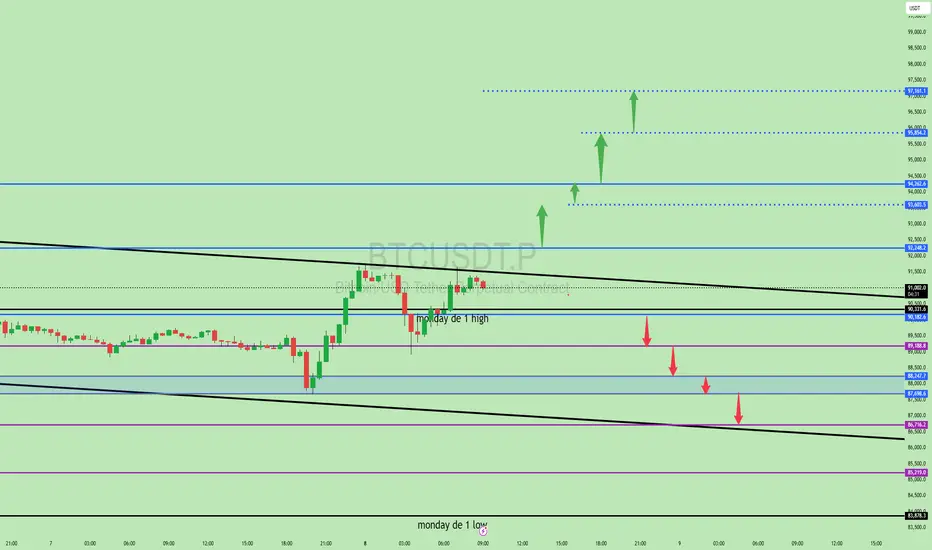
PRICE ACTION ANALYSIS OF YOUR CHART (BTCUSDT)
🟢 BUY SETUP (Bullish Scenario)
1️⃣ BUY ENTRY #1 — Break & Retest of 92,240 – 92,500 Zone
This zone is a major resistance.
A breakout above it confirms strong bullish momentum.
📌 ENTRY
Buy: 92,300 – 92,450
(After a breakout + retest candle, not inside consolidation)
📌 STOP LOSS (SL)
SL below retest zone: 91,700
📌 TAKE PROFIT (TP)
TP1 → 94,000 – 94,200
TP2 → 95,800
TP3 → 97,100
📌 PRICE ACTION REASON
Structure break above major resistance
Trendline break confirmation
Higher-high formation
Large liquidity zone above (clean traffic)
2️⃣ BUY ENTRY #2 — Pullback Into 90,300 Support
Your chart shows a horizontal blue line near 90,300–90,130.
📌 ENTRY
Buy at: 90,300 – 90,150
(Wait for bullish rejection wick)
📌 STOP LOSS
SL below structure: 89,800
📌 TAKE PROFIT
TP1 → 91,200
TP2 → 92,300
TP3 → 94,000
📌 PRICE ACTION REASON
Support formed around previous accumulation zone
Fake-out followed by impulse up (bullish sign)
Price respecting trendline + horizontal support
🔴 SELL SETUP (Bearish Scenario)
The red arrows on your chart highlight bearish continuation levels.
1️⃣ SELL ENTRY #1 — Break & Retest of 89,200 Zone (Major Level)
Price repeatedly reacts to this purple level → strong liquidity.
📌 ENTRY
Sell at: 89,200 – 89,100
(After bearish retest rejection)
📌 STOP LOSS
SL above level: 89,500
📌 TAKE PROFIT
TP1 → 88,200
TP2 → 87,000
TP3 → 86,700 (trendline bottom)
📌 PRICE ACTION REASON
Loss of support → becoming resistance
Bearish market structure (lower highs)
Clean traffic to downside (no strong support until next purple line)
2️⃣ SELL ENTRY #2 — Pullback to 90,300 Becomes Resistance
If the 90,300 level breaks DOWN, it becomes a good sell zone on retest.
📌 ENTRY
Sell at: 90,200–90,350
(Only if retested as resistance)
📌 STOP LOSS
SL: 90,700
📌 TAKE PROFIT
TP1 → 89,200
TP2 → 88,200
TP3 → 87,000
📌 PRICE ACTION REASON
Role reversal: support → resistance
Continuation in bearish channel
Lower-high formation
🟡 NO-TRADE ZONE
Avoid trading inside the black descending channel mid-area, especially around:
❌ 90,800 – 91,400
Because:
Price is choppy
Weak volume area
No clean structure
High chance of fake breakouts
Wait for clear breakout or breakdown.
🟢 BUY SETUP (Bullish Scenario)
1️⃣ BUY ENTRY #1 — Break & Retest of 92,240 – 92,500 Zone
This zone is a major resistance.
A breakout above it confirms strong bullish momentum.
📌 ENTRY
Buy: 92,300 – 92,450
(After a breakout + retest candle, not inside consolidation)
📌 STOP LOSS (SL)
SL below retest zone: 91,700
📌 TAKE PROFIT (TP)
TP1 → 94,000 – 94,200
TP2 → 95,800
TP3 → 97,100
📌 PRICE ACTION REASON
Structure break above major resistance
Trendline break confirmation
Higher-high formation
Large liquidity zone above (clean traffic)
2️⃣ BUY ENTRY #2 — Pullback Into 90,300 Support
Your chart shows a horizontal blue line near 90,300–90,130.
📌 ENTRY
Buy at: 90,300 – 90,150
(Wait for bullish rejection wick)
📌 STOP LOSS
SL below structure: 89,800
📌 TAKE PROFIT
TP1 → 91,200
TP2 → 92,300
TP3 → 94,000
📌 PRICE ACTION REASON
Support formed around previous accumulation zone
Fake-out followed by impulse up (bullish sign)
Price respecting trendline + horizontal support
🔴 SELL SETUP (Bearish Scenario)
The red arrows on your chart highlight bearish continuation levels.
1️⃣ SELL ENTRY #1 — Break & Retest of 89,200 Zone (Major Level)
Price repeatedly reacts to this purple level → strong liquidity.
📌 ENTRY
Sell at: 89,200 – 89,100
(After bearish retest rejection)
📌 STOP LOSS
SL above level: 89,500
📌 TAKE PROFIT
TP1 → 88,200
TP2 → 87,000
TP3 → 86,700 (trendline bottom)
📌 PRICE ACTION REASON
Loss of support → becoming resistance
Bearish market structure (lower highs)
Clean traffic to downside (no strong support until next purple line)
2️⃣ SELL ENTRY #2 — Pullback to 90,300 Becomes Resistance
If the 90,300 level breaks DOWN, it becomes a good sell zone on retest.
📌 ENTRY
Sell at: 90,200–90,350
(Only if retested as resistance)
📌 STOP LOSS
SL: 90,700
📌 TAKE PROFIT
TP1 → 89,200
TP2 → 88,200
TP3 → 87,000
📌 PRICE ACTION REASON
Role reversal: support → resistance
Continuation in bearish channel
Lower-high formation
🟡 NO-TRADE ZONE
Avoid trading inside the black descending channel mid-area, especially around:
❌ 90,800 – 91,400
Because:
Price is choppy
Weak volume area
No clean structure
High chance of fake breakouts
Wait for clear breakout or breakdown.

Disclaimer
The information and publications are not meant to be, and do not constitute, financial, investment, trading, or other types of advice or recommendations supplied or endorsed by TradingView. Read more in the Terms of Use.
Disclaimer
The information and publications are not meant to be, and do not constitute, financial, investment, trading, or other types of advice or recommendations supplied or endorsed by TradingView. Read more in the Terms of Use.