
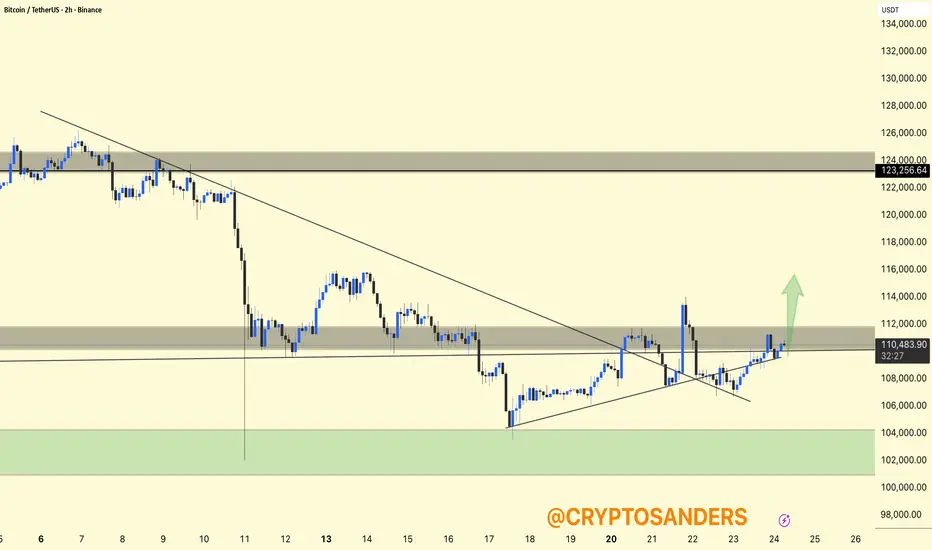
BTCUSDT Chart Analysis (2H).
Breakout: BTC has broken its descending trendline and reclaimed the $110,000 resistance area. Bulls are pushing the price towards the upper side of the supply zone marked around $112,000.
Setup: If BTC maintains a price above $110,000, the chart forecasts further upside, with the next resistance level at $115,000-$117,000.
Caution: Support is at $108,000-$110,000; losing this level could risk a retracement to $106,000-$104,000.
DYOR | NFA
Breakout: BTC has broken its descending trendline and reclaimed the $110,000 resistance area. Bulls are pushing the price towards the upper side of the supply zone marked around $112,000.
Setup: If BTC maintains a price above $110,000, the chart forecasts further upside, with the next resistance level at $115,000-$117,000.
Caution: Support is at $108,000-$110,000; losing this level could risk a retracement to $106,000-$104,000.
DYOR | NFA

Related publications
Disclaimer
The information and publications are not meant to be, and do not constitute, financial, investment, trading, or other types of advice or recommendations supplied or endorsed by TradingView. Read more in the Terms of Use.
Related publications
Disclaimer
The information and publications are not meant to be, and do not constitute, financial, investment, trading, or other types of advice or recommendations supplied or endorsed by TradingView. Read more in the Terms of Use.