
More exclusive indicators from BigBeluga
Subscribe to BigBeluga Premium for $66.47/month to get exclusive indicators by this author. You pay right on TradingView and can use them on your charts straight away.
Explore BigBeluga PremiumLesson 06 - Time Cycles
Difficulty: (Intermediate)
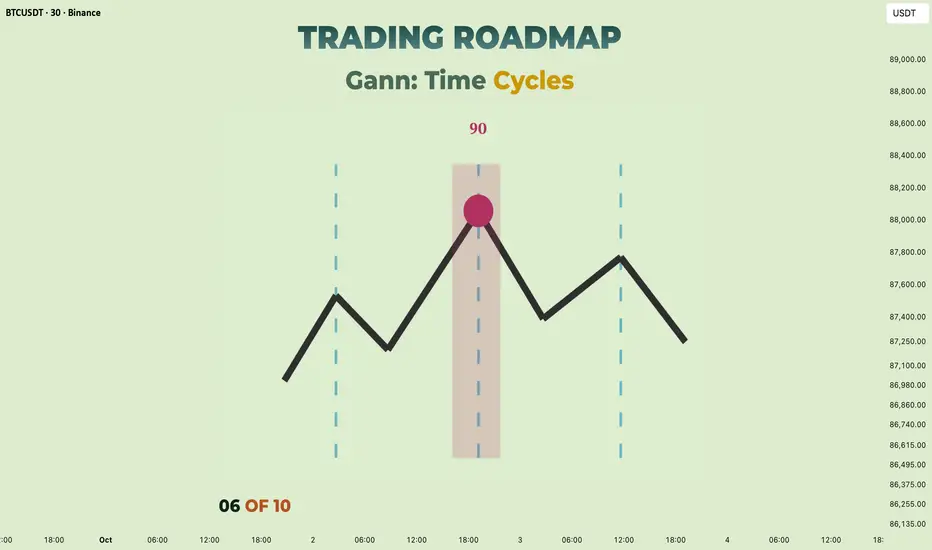
Every lesson so far has ended up on the vertical axis sooner or later. This one stays on the horizontal axis from beginning to end. A cycle is a count of bars and nothing else — it says nothing about price and nothing about direction, and it is the part of Gann's work most often presented as prophecy and most rarely tested. This lesson covers the counts he used, how to check whether a cycle is present at all, and what to do on the day a count arrives and the market ignores it.

Equal counts projected forward from one low. Three of the four lines catch a turn and one passes through the middle of a move with nothing happening at it. That ratio is what an honest example looks like, and any presentation of this tool without a miss in it is selling something.
🔵 QUICK RECAP FROM LESSON 05
Lesson 05 built the grid: one anchor, one unit, repeated in both directions, with vertical lines marking whole time units.
This lesson takes those vertical lines seriously on their own, without any price level attached to them.
🔵 1. WHAT A CYCLE IS, AND WHAT IT IS NOT
A time cycle is a claim that turns in a market tend to arrive at a repeating spacing.
- It is a statement about when, with nothing said about where
- It gives no direction — a cycle date can produce a high or a low
- It is a count from a specific starting point, so it inherits every problem an anchor has
That last point is worth sitting with. A cycle is not a property the market carries around with it. It is a property of a count you started, and someone counting from a different low has a different cycle.
🐳 Pro Tip: Write out what a cycle claim actually commits you to before using one: "turns in this market tend to arrive about every N bars, measured from this low." If it cannot be written that plainly, there is no claim to test.
🔵 2. THE COUNTS GANN USED
The numbers are the same divisions that ran through the whole course, applied to the horizontal axis.

The counts laid out in proportion. They are the circle divided — a twelfth, a sixth, a quarter, a half and a whole — carried across to a count of bars or days. Nothing about a market requires these particular numbers; they are conventions with a long history of being watched.
- 30 · 60 · 90 — a twelfth, a sixth and a quarter of the circle
- 120 · 180 — a third and a half
- 360 — the full turn, and the anniversary of the starting date
Gann paid particular attention to anniversary dates: the same calendar point a year after a significant high or low. It is the most testable of his time ideas and also the one most easily explained by ordinary seasonality.
🐳 Pro Tip: Start with 90 and 180. If a market has nothing at either of those from a major pivot, adding more counts rarely rescues it.
🔵 3. COUNT THE SAME WAY EVERY TIME
This sounds trivial and it is where most cycle work quietly falls apart.

One span between the same two turns, counted two ways. Calendar days include the days the market was shut; trading bars do not. Both numbers are correct and they are not interchangeable, so a cycle measured one way cannot be checked against a count made the other way.
- Decide on calendar days or trading bars and never mix them
- Count from a turn the market clearly made, not from a minor swing
- Count from one anchor — adding a second anchor doubles your lines and halves the meaning
- Write the choice down next to the instrument, as with the unit in Lesson 04
🐳 Pro Tip: Trading bars are the more defensible choice for intraday and futures work, calendar days for long-horizon anniversary work. The mistake is not picking one — it is switching.
🔵 4. TESTING WHETHER A CYCLE IS THERE AT ALL
This is the section that separates a measurement from a belief, and it takes about ten minutes.

Every major turn marked, and every spacing between consecutive turns measured and written down. Three of the four cluster near the same number; the fourth is nowhere near it. A cycle claim lives or dies on that distribution, not on the turns that happen to fit.
The procedure:
1. Mark every major turn over a long stretch — not the ones that support the idea
2. Measure the spacing between consecutive turns and list the numbers
3. Look at whether they cluster, and how tightly
4. Count the misses as carefully as the hits
5. Ask whether a different count would fit the same data equally well
If the spacings are scattered, there is no cycle to find and no amount of adding counts changes that. If three or four of five cluster within a few bars, there is something worth watching — stated at that strength and no higher.
🐳 Pro Tip: The most useful output of this exercise is often a negative result. Knowing that a market has no usable time cycle saves more money than finding one.
🔵 5. A WINDOW, NOT A POINT
The expectation has to be calibrated or the tool becomes unusable within a week.

Two counts arriving. At the first, price turns inside the window. At the second, nothing happens — the date passes in the middle of a move. Both outcomes are normal, and a method that treats the second as a failure has the wrong expectation built into it.
- A count is a window of a few bars either side, not a single bar
- A date arriving with no price event is a date that passed, and that is all
- The count says when to look; price still has to supply the event
- A turn inside the window with no structural confirmation is still not an entry
🐳 Pro Tip: Set the tolerance in advance and in proportion — roughly a tenth of the count. For a 90-bar cycle that is about nine bars either side, and deciding it afterwards is how a window becomes whatever it needs to be.
🔵 6. THE FAILURE MODE
Every criticism of cycle work reduces to one mechanism, and it is worth seeing it rather than reading about it.

One anchor with twelve counts projected from it. Every turn on the chart is close to one of the lines, and the tool has therefore explained everything and predicted nothing. Nothing was added except more lines.
- With enough counts, a line sits near every turn by construction
- Subdividing a cycle into halves and quarters produces the same effect quietly
- Choosing which count "worked" after the turn is not analysis
The defence is a number decided in advance: two counts from one anchor, and no more, no matter how tempting the third one looks.
🐳 Pro Tip: Count the vertical lines on your chart. If there are more than four, the tool has stopped being able to tell you anything you did not already decide.
🔵 7. WHEN A CYCLE STOPS
Cycles that were present in a market do fade, and they give no notice.
- Two or three consecutive counts passing with nothing at them is the signal to stop
- A change in what drives the market — a new regime, a structural change in the instrument — commonly ends one
- A cycle that needs its length adjusted to keep working has already ended
The honest position is that a cycle is an observation about a stretch of history that may or may not continue, and treating it as a permanent property of the market is where the trouble starts.
🐳 Pro Tip: Keep a short log of each count you projected and what happened at it. Three blanks in a row is a clearer stop signal than any feeling about it.
🔵 8. A DISCIPLINED WAY TO USE IT
- One anchor — a major high or low, chosen for a reason you can say out loud
- One counting method — bars or calendar days, written down
- Two counts at most, starting with 90 and 180
- A window in proportion, set before the date arrives
- Tested first on history, with the misses counted
- Retired after three consecutive blanks
Used this way a cycle is a way of allocating attention: it tells you which weeks to watch closely and which to leave alone. That is a smaller claim than the literature usually makes, and it is the one that survives testing.
🐳 Pro Tip: A cycle date is at its most useful when it lands on a level you already had. Time on its own raises attention; time and price together narrow the area.
🔵 COMMON MISTAKES
- Mixing calendar days and trading bars in the same study
- Counting from a swing chosen because it makes the numbers work
- Marking only the turns that fit and calling the result a cycle
- Treating a date as a forecast rather than as a window to watch
- Adding a third, fourth and fifth count until something fits
- Deciding the tolerance after the date has passed
- Keeping a cycle alive by adjusting its length
🔵 QUICK SELF-CHECK
- Mark every major turn on your chart over the last two years and list the spacings
- Ask whether those numbers cluster, and write down how tight the cluster is
- Project 90 and 180 forward from the clearest pivot and mark the windows now
- Count the vertical lines currently on your chart and remove everything past the second
- Look back at the last three counts you projected and write down what actually happened at each
🔵 WHAT IS NEXT
Lesson 07 brings the two axes back together for the idea the whole course has been building toward: the balance of price and time — what it means for a move to have travelled as far as it has lasted, and how Gann used that balance to mark the points where a move has run its course.
Worth sitting with before then: a date is not a forecast. It is a decision about where to spend your attention, and that is worth less than a prediction and considerably more than nothing.
Full Trading Roadmap | Gann Course
Trading Roadmap | Gann · Lesson 01 — Price and Time
Trading Roadmap | Gann · Lesson 02 — The Square of Nine
Trading Roadmap | Gann · Lesson 03 — The Gann Fan
Trading Roadmap | Gann · Lesson 04 — The 1×1 Angle
Trading Roadmap | Gann · Lesson 05 — The Gann Grid
Best Regards, BigBeluga 🐳
Difficulty: (Intermediate)
Every lesson so far has ended up on the vertical axis sooner or later. This one stays on the horizontal axis from beginning to end. A cycle is a count of bars and nothing else — it says nothing about price and nothing about direction, and it is the part of Gann's work most often presented as prophecy and most rarely tested. This lesson covers the counts he used, how to check whether a cycle is present at all, and what to do on the day a count arrives and the market ignores it.
Equal counts projected forward from one low. Three of the four lines catch a turn and one passes through the middle of a move with nothing happening at it. That ratio is what an honest example looks like, and any presentation of this tool without a miss in it is selling something.
🔵 QUICK RECAP FROM LESSON 05
Lesson 05 built the grid: one anchor, one unit, repeated in both directions, with vertical lines marking whole time units.
This lesson takes those vertical lines seriously on their own, without any price level attached to them.
🔵 1. WHAT A CYCLE IS, AND WHAT IT IS NOT
A time cycle is a claim that turns in a market tend to arrive at a repeating spacing.
- It is a statement about when, with nothing said about where
- It gives no direction — a cycle date can produce a high or a low
- It is a count from a specific starting point, so it inherits every problem an anchor has
That last point is worth sitting with. A cycle is not a property the market carries around with it. It is a property of a count you started, and someone counting from a different low has a different cycle.
🐳 Pro Tip: Write out what a cycle claim actually commits you to before using one: "turns in this market tend to arrive about every N bars, measured from this low." If it cannot be written that plainly, there is no claim to test.
🔵 2. THE COUNTS GANN USED
The numbers are the same divisions that ran through the whole course, applied to the horizontal axis.
The counts laid out in proportion. They are the circle divided — a twelfth, a sixth, a quarter, a half and a whole — carried across to a count of bars or days. Nothing about a market requires these particular numbers; they are conventions with a long history of being watched.
- 30 · 60 · 90 — a twelfth, a sixth and a quarter of the circle
- 120 · 180 — a third and a half
- 360 — the full turn, and the anniversary of the starting date
Gann paid particular attention to anniversary dates: the same calendar point a year after a significant high or low. It is the most testable of his time ideas and also the one most easily explained by ordinary seasonality.
🐳 Pro Tip: Start with 90 and 180. If a market has nothing at either of those from a major pivot, adding more counts rarely rescues it.
🔵 3. COUNT THE SAME WAY EVERY TIME
This sounds trivial and it is where most cycle work quietly falls apart.
One span between the same two turns, counted two ways. Calendar days include the days the market was shut; trading bars do not. Both numbers are correct and they are not interchangeable, so a cycle measured one way cannot be checked against a count made the other way.
- Decide on calendar days or trading bars and never mix them
- Count from a turn the market clearly made, not from a minor swing
- Count from one anchor — adding a second anchor doubles your lines and halves the meaning
- Write the choice down next to the instrument, as with the unit in Lesson 04
🐳 Pro Tip: Trading bars are the more defensible choice for intraday and futures work, calendar days for long-horizon anniversary work. The mistake is not picking one — it is switching.
🔵 4. TESTING WHETHER A CYCLE IS THERE AT ALL
This is the section that separates a measurement from a belief, and it takes about ten minutes.
Every major turn marked, and every spacing between consecutive turns measured and written down. Three of the four cluster near the same number; the fourth is nowhere near it. A cycle claim lives or dies on that distribution, not on the turns that happen to fit.
The procedure:
1. Mark every major turn over a long stretch — not the ones that support the idea
2. Measure the spacing between consecutive turns and list the numbers
3. Look at whether they cluster, and how tightly
4. Count the misses as carefully as the hits
5. Ask whether a different count would fit the same data equally well
If the spacings are scattered, there is no cycle to find and no amount of adding counts changes that. If three or four of five cluster within a few bars, there is something worth watching — stated at that strength and no higher.
🐳 Pro Tip: The most useful output of this exercise is often a negative result. Knowing that a market has no usable time cycle saves more money than finding one.
🔵 5. A WINDOW, NOT A POINT
The expectation has to be calibrated or the tool becomes unusable within a week.
Two counts arriving. At the first, price turns inside the window. At the second, nothing happens — the date passes in the middle of a move. Both outcomes are normal, and a method that treats the second as a failure has the wrong expectation built into it.
- A count is a window of a few bars either side, not a single bar
- A date arriving with no price event is a date that passed, and that is all
- The count says when to look; price still has to supply the event
- A turn inside the window with no structural confirmation is still not an entry
🐳 Pro Tip: Set the tolerance in advance and in proportion — roughly a tenth of the count. For a 90-bar cycle that is about nine bars either side, and deciding it afterwards is how a window becomes whatever it needs to be.
🔵 6. THE FAILURE MODE
Every criticism of cycle work reduces to one mechanism, and it is worth seeing it rather than reading about it.
One anchor with twelve counts projected from it. Every turn on the chart is close to one of the lines, and the tool has therefore explained everything and predicted nothing. Nothing was added except more lines.
- With enough counts, a line sits near every turn by construction
- Subdividing a cycle into halves and quarters produces the same effect quietly
- Choosing which count "worked" after the turn is not analysis
The defence is a number decided in advance: two counts from one anchor, and no more, no matter how tempting the third one looks.
🐳 Pro Tip: Count the vertical lines on your chart. If there are more than four, the tool has stopped being able to tell you anything you did not already decide.
🔵 7. WHEN A CYCLE STOPS
Cycles that were present in a market do fade, and they give no notice.
- Two or three consecutive counts passing with nothing at them is the signal to stop
- A change in what drives the market — a new regime, a structural change in the instrument — commonly ends one
- A cycle that needs its length adjusted to keep working has already ended
The honest position is that a cycle is an observation about a stretch of history that may or may not continue, and treating it as a permanent property of the market is where the trouble starts.
🐳 Pro Tip: Keep a short log of each count you projected and what happened at it. Three blanks in a row is a clearer stop signal than any feeling about it.
🔵 8. A DISCIPLINED WAY TO USE IT
- One anchor — a major high or low, chosen for a reason you can say out loud
- One counting method — bars or calendar days, written down
- Two counts at most, starting with 90 and 180
- A window in proportion, set before the date arrives
- Tested first on history, with the misses counted
- Retired after three consecutive blanks
Used this way a cycle is a way of allocating attention: it tells you which weeks to watch closely and which to leave alone. That is a smaller claim than the literature usually makes, and it is the one that survives testing.
🐳 Pro Tip: A cycle date is at its most useful when it lands on a level you already had. Time on its own raises attention; time and price together narrow the area.
🔵 COMMON MISTAKES
- Mixing calendar days and trading bars in the same study
- Counting from a swing chosen because it makes the numbers work
- Marking only the turns that fit and calling the result a cycle
- Treating a date as a forecast rather than as a window to watch
- Adding a third, fourth and fifth count until something fits
- Deciding the tolerance after the date has passed
- Keeping a cycle alive by adjusting its length
🔵 QUICK SELF-CHECK
- Mark every major turn on your chart over the last two years and list the spacings
- Ask whether those numbers cluster, and write down how tight the cluster is
- Project 90 and 180 forward from the clearest pivot and mark the windows now
- Count the vertical lines currently on your chart and remove everything past the second
- Look back at the last three counts you projected and write down what actually happened at each
🔵 WHAT IS NEXT
Lesson 07 brings the two axes back together for the idea the whole course has been building toward: the balance of price and time — what it means for a move to have travelled as far as it has lasted, and how Gann used that balance to mark the points where a move has run its course.
Worth sitting with before then: a date is not a forecast. It is a decision about where to spend your attention, and that is worth less than a prediction and considerably more than nothing.
Full Trading Roadmap | Gann Course
Trading Roadmap | Gann · Lesson 01 — Price and Time
Trading Roadmap | Gann · Lesson 02 — The Square of Nine
Trading Roadmap | Gann · Lesson 03 — The Gann Fan
Trading Roadmap | Gann · Lesson 04 — The 1×1 Angle
Trading Roadmap | Gann · Lesson 05 — The Gann Grid
Best Regards, BigBeluga 🐳

🌐 bigbeluga.org/tv - Get access to our powerful tools & indicators.
🔵 Learn More -> docs.bigbeluga.org/
🔵 Join Discord -> go.bigbeluga.org/k65q9bfqfu
All content provided by BigBeluga is for educational purposes only
🔵 Learn More -> docs.bigbeluga.org/
🔵 Join Discord -> go.bigbeluga.org/k65q9bfqfu
All content provided by BigBeluga is for educational purposes only
Related publications
Disclaimer
The information and publications are not meant to be, and do not constitute, financial, investment, trading, or other types of advice or recommendations supplied or endorsed by TradingView. Read more in the Terms of Use.
🌐 bigbeluga.org/tv - Get access to our powerful tools & indicators.
🔵 Learn More -> docs.bigbeluga.org/
🔵 Join Discord -> go.bigbeluga.org/k65q9bfqfu
All content provided by BigBeluga is for educational purposes only
🔵 Learn More -> docs.bigbeluga.org/
🔵 Join Discord -> go.bigbeluga.org/k65q9bfqfu
All content provided by BigBeluga is for educational purposes only
Related publications
Disclaimer
The information and publications are not meant to be, and do not constitute, financial, investment, trading, or other types of advice or recommendations supplied or endorsed by TradingView. Read more in the Terms of Use.