
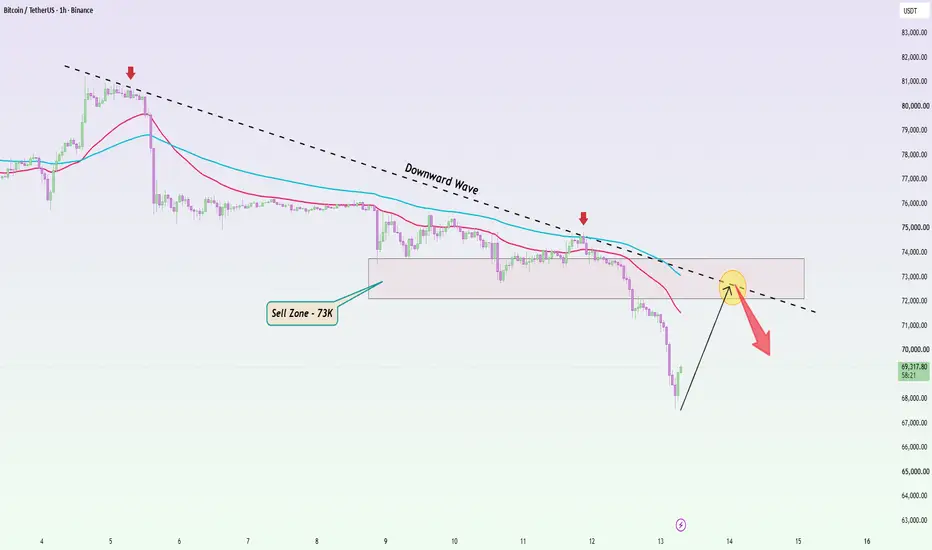
Bitcoin's selloff is accelerating, with price falling toward 69K after another failed recovery. The question now isn't whether BTC can bounce, but whether buyers can sustain that recovery against the broader bearish trend.
On the 1H chart, BTC remains below both declining EMAs, while the descending trendline continues to produce lower highs. The former 72K–73.8K support zone has become resistance. Even if price rebounds sharply from its recent lows, that move could simply offer sellers another opportunity to enter.
The macro backdrop reinforces this weakness. The US dollar is hovering near a 19-month high, supported by rising Treasury yields and growing expectations of further Fed tightening.
My preferred approach is to wait for a recovery toward 72K–73.8K rather than chase the current selloff. A rejection from this zone could send BTC back toward 70K, followed by 68K and potentially a retest of the recent lows. A sustained recovery above 73.8K would weaken this bearish setup.
Preferred scenario: SELL on recovery toward 72K–73.8K → rejection → 70K → 68K.
On the 1H chart, BTC remains below both declining EMAs, while the descending trendline continues to produce lower highs. The former 72K–73.8K support zone has become resistance. Even if price rebounds sharply from its recent lows, that move could simply offer sellers another opportunity to enter.
The macro backdrop reinforces this weakness. The US dollar is hovering near a 19-month high, supported by rising Treasury yields and growing expectations of further Fed tightening.
My preferred approach is to wait for a recovery toward 72K–73.8K rather than chase the current selloff. A rejection from this zone could send BTC back toward 70K, followed by 68K and potentially a retest of the recent lows. A sustained recovery above 73.8K would weaken this bearish setup.
Preferred scenario: SELL on recovery toward 72K–73.8K → rejection → 70K → 68K.
Trade active
Trade closed: target reached

Hi, I'm Domic. I break Bitcoin down one level at a time, so you know where to act and where to wait.
Daily BTC maps and market updates in my free Telegram:
t.me/+dfxDTk_DRtg4Mzll
Educational content, not financial advice.
Daily BTC maps and market updates in my free Telegram:
t.me/+dfxDTk_DRtg4Mzll
Educational content, not financial advice.
Related publications
Disclaimer
The information and publications are not meant to be, and do not constitute, financial, investment, trading, or other types of advice or recommendations supplied or endorsed by TradingView. Read more in the Terms of Use.
Hi, I'm Domic. I break Bitcoin down one level at a time, so you know where to act and where to wait.
Daily BTC maps and market updates in my free Telegram:
t.me/+dfxDTk_DRtg4Mzll
Educational content, not financial advice.
Daily BTC maps and market updates in my free Telegram:
t.me/+dfxDTk_DRtg4Mzll
Educational content, not financial advice.
Related publications
Disclaimer
The information and publications are not meant to be, and do not constitute, financial, investment, trading, or other types of advice or recommendations supplied or endorsed by TradingView. Read more in the Terms of Use.