
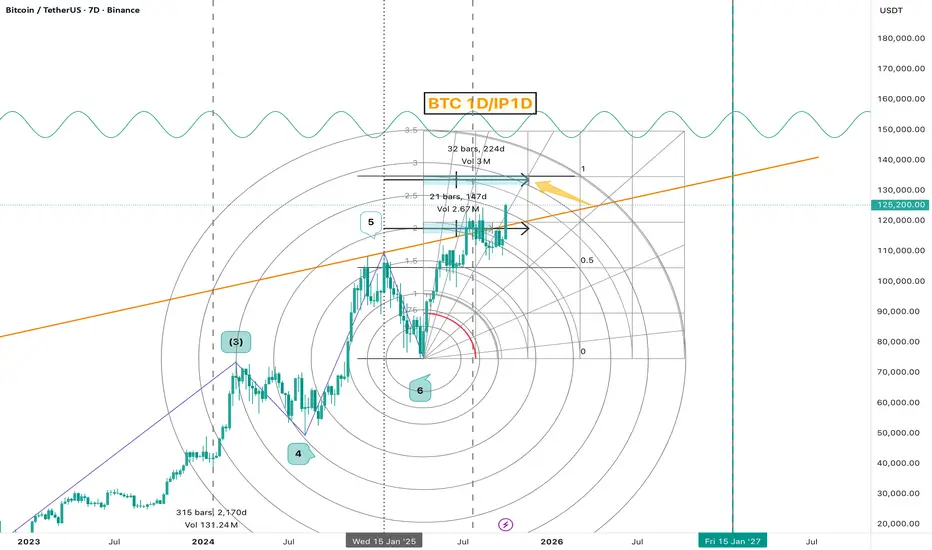
Here's a technical analysis of your BTC chart:
📊 **Chart Overview: BTCUSDT 7D (Weekly) Timeframe**
🎯 **Key Patterns Identified:**
**1. Cup & Handle Formation** ☕
- Large cup pattern formed from 2023-2024
- Handle currently forming in the consolidation zone
- Classic bullish continuation pattern
- Breakout target potentially above $150K based on cup depth
**2. Fibonacci Levels** 📐
- Price consolidated around 0.5 Fibonacci retracement (~$125K area)
- Strong resistance at 0.618 level
- Currently testing key support/resistance zone
**3. Trend Analysis** 📈
- **Orange ascending trendline**: Long-term bullish support from 2023
- Price respecting this major uptrend
- Multiple touches confirm validity
**4. TesseractPro Oscillator** 🌊
- Currently showing: 2,159.10 / 1,187.49
- Peaked and now declining
- Suggests momentum cooling off
- Potential bearish divergence forming
**5. Volume Analysis** 📊
- **Vol 3M**: Shows declining volume during recent consolidation
- Lower volume = weaker conviction
- Need volume spike for breakout confirmation
**6. Price Action Zones** 🎯
- **Current Price**: ~$132,965
- **Resistance**: $140K-$150K zone
- **Support**: $110K-$120K area (handle bottom)
- **Critical support**: Orange trendline (~$90K-$100K)
**7. Cycle Analysis** ⏰
- Chart shows projection into 2027
- Suggests multi-year bullish cycle continuation
- Current consolidation is healthy for next leg up
**Scenarios:**
📈 **Bullish Case:**
- Break above $140K with volume confirms cup & handle
- Target: $180K+ based on pattern projection
- Orange trendline holds as dynamic support
📉 **Bearish Case:**
- Break below handle support (~$110K)
- Oscillator weakness continues
- Could retest orange trendline (~$90K-$100K)
- Still bullish long-term if trendline holds
**Current Status:** ⚖️
Price is in consolidation/handle formation. Oscillator weakness suggests potential pullback before next major move up. Watch for volume expansion and trendline support.
**Key Levels to Watch:**
- 🟢 Breakout: $140K+
- 🔴 Breakdown: $110K
- 🚨 Critical: $90K (trendline)
The overall structure remains bullish long-term, but short-term consolidation or pullback is possible given oscillator divergence and low volume. 📊✨

Disclaimer
The information and publications are not meant to be, and do not constitute, financial, investment, trading, or other types of advice or recommendations supplied or endorsed by TradingView. Read more in the Terms of Use.
Disclaimer
The information and publications are not meant to be, and do not constitute, financial, investment, trading, or other types of advice or recommendations supplied or endorsed by TradingView. Read more in the Terms of Use.