
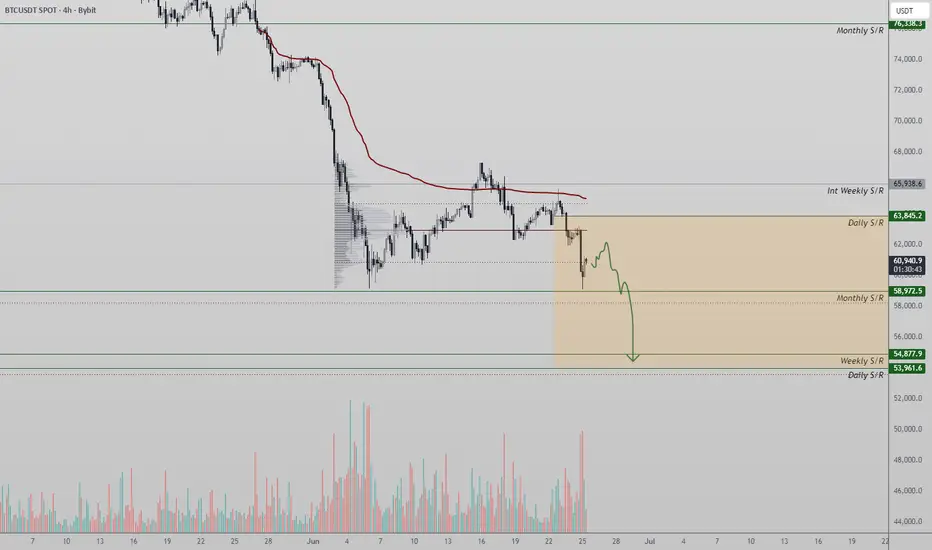
Bitcoin is currently trading at a critical higher-timeframe support level around $58,000, a monthly zone that could determine the direction of the next major move. Price action continues to show signs of weakness, with sellers maintaining control as Bitcoin struggles beneath multiple layers of resistance. The inability to reclaim these resistance levels suggests that bullish momentum remains limited in the immediate short term.
The $58,000 support is the key level to monitor. As long as price remains above it, there is still potential for buyers to defend the region and stabilize the market. However, a decisive breakdown below this monthly support would significantly increase the probability of another leg lower.
If sellers successfully push Bitcoin beneath $58,000, the next major downside objective sits around $54,000. This level aligns with a higher-timeframe Fibonacci retracement ratio, making it an important area where buyers could begin looking for value and where a larger reaction may occur. Fibonacci confluence often creates strong support zones, particularly when combined with major historical price levels.
From a technical perspective, the market remains under pressure until proven otherwise. The current structure favors continued downside while Bitcoin trades below key resistance levels, with momentum still leaning in favor of sellers. Until buyers reclaim higher levels and establish a stronger market structure, the path of least resistance remains to the downside, making $54,000 the next major target should the monthly support fail to hold.
The $58,000 support is the key level to monitor. As long as price remains above it, there is still potential for buyers to defend the region and stabilize the market. However, a decisive breakdown below this monthly support would significantly increase the probability of another leg lower.
If sellers successfully push Bitcoin beneath $58,000, the next major downside objective sits around $54,000. This level aligns with a higher-timeframe Fibonacci retracement ratio, making it an important area where buyers could begin looking for value and where a larger reaction may occur. Fibonacci confluence often creates strong support zones, particularly when combined with major historical price levels.
From a technical perspective, the market remains under pressure until proven otherwise. The current structure favors continued downside while Bitcoin trades below key resistance levels, with momentum still leaning in favor of sellers. Until buyers reclaim higher levels and establish a stronger market structure, the path of least resistance remains to the downside, making $54,000 the next major target should the monthly support fail to hold.

Join the Free Trading Group
Telegram: t.me/freetradingden 🔥
Claim $1000 Deposit Bonus 🎁
Trade with perks & support the community!
partner.blofin.com/d/TheAlchemist
Stay sharp, trade smart.
— Team The Alchemist ⚔️
Telegram: t.me/freetradingden 🔥
Claim $1000 Deposit Bonus 🎁
Trade with perks & support the community!
partner.blofin.com/d/TheAlchemist
Stay sharp, trade smart.
— Team The Alchemist ⚔️
Disclaimer
The information and publications are not meant to be, and do not constitute, financial, investment, trading, or other types of advice or recommendations supplied or endorsed by TradingView. Read more in the Terms of Use.
Join the Free Trading Group
Telegram: t.me/freetradingden 🔥
Claim $1000 Deposit Bonus 🎁
Trade with perks & support the community!
partner.blofin.com/d/TheAlchemist
Stay sharp, trade smart.
— Team The Alchemist ⚔️
Telegram: t.me/freetradingden 🔥
Claim $1000 Deposit Bonus 🎁
Trade with perks & support the community!
partner.blofin.com/d/TheAlchemist
Stay sharp, trade smart.
— Team The Alchemist ⚔️
Disclaimer
The information and publications are not meant to be, and do not constitute, financial, investment, trading, or other types of advice or recommendations supplied or endorsed by TradingView. Read more in the Terms of Use.