
Hey there, crypto community and trading maestros! 🚀 NeuralTraderingPro is back, ready to guide you through the mists of market uncertainty straight to the peaks of profit. It’s Wednesday, September 17th, and the market is buzzing with anticipation for fresh movements. Let's break down who's calling the shots this week!
📜 FORECAST REVIEW: THE BULLS BROKE THROUGH!
My analysis from yesterday played out with laser-like precision! 🎯 I highlighted a colossal sell wall at 115,837 USDT and stated, "If buyers 'devour' this wall... it will be a powerful signal of their strength." And that's exactly what happened! Fueled by positive news, the bulls obliterated that resistance. My aggressive trading idea, "Long 1: Buy immediately after the breakout... above the wall at 115,900 USDT," proved to be golden. The price surged upwards, reaching current levels around 116,500 USDT. The bearish scenario was completely invalidated. Congratulations to everyone who followed this plan and rode the wave of growth!
📊 CURRENT SITUATION: CHART AND INDICATOR ANALYSIS
Current Price: 116511.1 USDT
📈 Daily Chart (1D): The global uptrend remains firmly in place. The price has solidified its position above the SMA 20 and SMA 50, confirming a long-term bullish outlook. RSI is in buyer territory (around 65) but hasn't yet reached overbought levels, leaving fuel for further ascent. MACD in the positive zone continues its climb. The structure looks poised for the price to attack new highs.
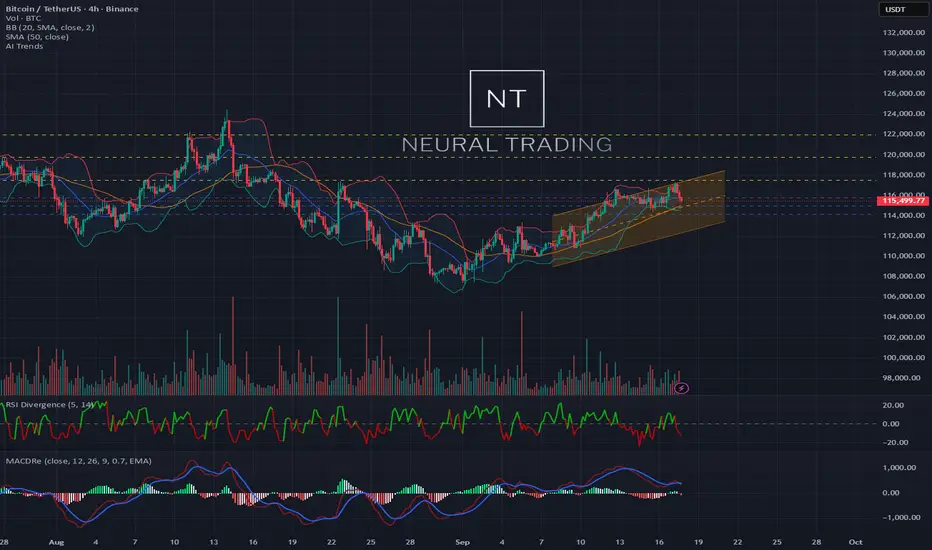
💹 4-Hour Chart (4H): Here, we see the aftermath of yesterday's bullish triumph. The price has formed a clear ascending channel. After breaking through resistance at 115,800, that level has now become mirrored support. The price is trading near the upper Bollinger Band, which is expanding, indicating high volatility and buyer strength. Both RSI and MACD indicators are confidently in bullish territory, confirming the strength of the current momentum.
⏱️ 30-Minute Chart (30m): On the lower timeframe, we observe a consolidation phase after the impulsive surge. The price is moving within a narrow range of 116,200 - 116,700 USDT, accumulating energy. This resembles the formation of a "bull flag" or pennant – a classic trend continuation pattern. RSI has cooled off from peak values, which is healthy for sustainable growth.
📋 ORDER BOOK ANALYSIS: A FORTRESS AT 116,500
The battle has moved to a new front!
🟢 Support Walls: Buyers have constructed a formidable defensive redoubt. Directly below the current price, at 116,500 USDT, stands a massive buy wall exceeding 13 BTC (worth approximately 1.5 million USDT). This is a very strong signal: the bulls have no intention of surrendering their conquered positions and are ready to buy up any dips.
🔴 Resistance Walls: Sellers aren't giving up and have built a layered defense. The nearest large order is precisely at 116,511 USDT (nearly 6 BTC). Higher up, in the range of 116,526 - 116,562 USDT, there's a cluster of sell orders. This is the zone the bulls need to overcome to continue the rally.
Conclusion: Buyers have taken a dominant position, establishing powerful support. Sellers are attempting to stem the tide, but their resistance appears more scattered compared to the monolithic buyer wall.
📰 MARKET SENTIMENT AND KEY THEMES
The news flow remains predominantly bullish, creating a tailwind for price appreciation.
🏦 Institutional Scarcity. Fidelity's forecast that 28% of bitcoins could soon vanish from the market due to long-term HODLing is a potent long-term bullish factor. This is a fundamental basis for a "supply shock."
🇦🇷 Argentinian Catalyst. Calls from economists for a shift to Bitcoin amid the potential collapse of Argentina's financial system once again fuel the narrative of BTC as a refuge from hyperinflation and fiat currency instability.
🎯 $117,500 Level in Focus. Analysts are unanimously emphasizing this level. A breach would serve as technical confirmation of a major rally beginning towards $122,000, creating a self-fulfilling prophecy effect as many traders will place their orders just beyond this mark.
🏛️ Fed Uncertainty. Experts are divided on the impact of the upcoming Fed interest rate decision. This is the primary source of potential volatility this week. The decision could either accelerate growth (in case of policy easing) or trigger a short-term correction.
🇷🇺 Russian Legalization. Sberbank, Russia's largest bank, launching a financial asset pegged to a basket of Bitcoin and Ethereum is a huge step towards cryptocurrency adoption in Russia and a signal for major capital.
🔮 FORECAST AND KEY TARGETS FOR THE WEEK (September 17-24)
The technical picture, order book analysis, and positive news flow create all the conditions for continued upward movement. The main risk is the uncertainty surrounding the Fed meeting. A breakthrough of the current consolidation upwards will open the way to the week's main targets.
Scenario Probability: Long 📈 (70%) / Short 📉 (30%)
🎯 Key Targets for the Upcoming Week:
UP Targets (in case of consolidation breakout):
🐂 117,500 USDT - Technical and psychological trigger for the main growth wave.
🐂🐂 119,800 USDT - Next profit-taking zone before the important 120k level.
🐂🐂🐂 122,000 USDT - Optimistic weekly target, based on graphical model projections.
DOWN Targets (in case of false breakout and correction):
🐻 115,800 USDT - Mirrored level, former resistance, now the first strong support.
🐻🐻 115,000 USDT - Psychological mark and a zone where buyer activity was observed yesterday.
🐻🐻🐻 114,200 USDT - Key support on the 4H chart; its loss could break the bullish structure.
💡 TRADING IDEAS
Long Positions (Long) — With the Trend.
Long Idea 1 (Aggressive): Buy on a breakout of the upper boundary of the current consolidation (above 116,800 USDT). Target: 117,500. Stop-loss: 116,350 USDT.
Long Idea 2 (Conservative): Buy on a retest of the 115,800 - 116,000 USDT support zone if the market pulls back. Targets: 117,500, 119,800 USDT. Stop-loss: 115,400 USDT.
Short Positions (Short) — Against the Wind.
Short Idea 1 (Risky): Sell only if a clear false breakout of the 117,500 level forms. For example, a sharp rise followed by an equally sharp drop back below this level. Target: 116,000. Stop-loss: 117,950 USDT.
Short Idea 2 (Structural Break): Short only if there's a confident break and consolidation below the strong 115,800 USDT support. This would signal that all of yesterday's growth was a bull trap. Targets: 115,000, 114,200 USDT. Stop-loss: 116,300 USDT.
🛡️ CONCLUSION AND RECOMMENDATIONS
The market is clearly under bull control. Price structure, sentiment, and news flow all point towards continued growth. The coming hours will reveal whether the current pause was an accumulation of strength before a new assault. I recommend trading with the trend but being prepared for increased volatility around Fed news days. Always use stop-losses 🛡️ — they are your best defense in the world of crypto!
May your trades be green and your profits cosmic! 💰 Don't forget to give this analysis a thumbs up 👍 and subscribe to always stay one step ahead of the market!
📜 FORECAST REVIEW: THE BULLS BROKE THROUGH!
My analysis from yesterday played out with laser-like precision! 🎯 I highlighted a colossal sell wall at 115,837 USDT and stated, "If buyers 'devour' this wall... it will be a powerful signal of their strength." And that's exactly what happened! Fueled by positive news, the bulls obliterated that resistance. My aggressive trading idea, "Long 1: Buy immediately after the breakout... above the wall at 115,900 USDT," proved to be golden. The price surged upwards, reaching current levels around 116,500 USDT. The bearish scenario was completely invalidated. Congratulations to everyone who followed this plan and rode the wave of growth!
📊 CURRENT SITUATION: CHART AND INDICATOR ANALYSIS
Current Price: 116511.1 USDT
📈 Daily Chart (1D): The global uptrend remains firmly in place. The price has solidified its position above the SMA 20 and SMA 50, confirming a long-term bullish outlook. RSI is in buyer territory (around 65) but hasn't yet reached overbought levels, leaving fuel for further ascent. MACD in the positive zone continues its climb. The structure looks poised for the price to attack new highs.
💹 4-Hour Chart (4H): Here, we see the aftermath of yesterday's bullish triumph. The price has formed a clear ascending channel. After breaking through resistance at 115,800, that level has now become mirrored support. The price is trading near the upper Bollinger Band, which is expanding, indicating high volatility and buyer strength. Both RSI and MACD indicators are confidently in bullish territory, confirming the strength of the current momentum.
⏱️ 30-Minute Chart (30m): On the lower timeframe, we observe a consolidation phase after the impulsive surge. The price is moving within a narrow range of 116,200 - 116,700 USDT, accumulating energy. This resembles the formation of a "bull flag" or pennant – a classic trend continuation pattern. RSI has cooled off from peak values, which is healthy for sustainable growth.
📋 ORDER BOOK ANALYSIS: A FORTRESS AT 116,500
The battle has moved to a new front!
🟢 Support Walls: Buyers have constructed a formidable defensive redoubt. Directly below the current price, at 116,500 USDT, stands a massive buy wall exceeding 13 BTC (worth approximately 1.5 million USDT). This is a very strong signal: the bulls have no intention of surrendering their conquered positions and are ready to buy up any dips.
🔴 Resistance Walls: Sellers aren't giving up and have built a layered defense. The nearest large order is precisely at 116,511 USDT (nearly 6 BTC). Higher up, in the range of 116,526 - 116,562 USDT, there's a cluster of sell orders. This is the zone the bulls need to overcome to continue the rally.
Conclusion: Buyers have taken a dominant position, establishing powerful support. Sellers are attempting to stem the tide, but their resistance appears more scattered compared to the monolithic buyer wall.
📰 MARKET SENTIMENT AND KEY THEMES
The news flow remains predominantly bullish, creating a tailwind for price appreciation.
🏦 Institutional Scarcity. Fidelity's forecast that 28% of bitcoins could soon vanish from the market due to long-term HODLing is a potent long-term bullish factor. This is a fundamental basis for a "supply shock."
🇦🇷 Argentinian Catalyst. Calls from economists for a shift to Bitcoin amid the potential collapse of Argentina's financial system once again fuel the narrative of BTC as a refuge from hyperinflation and fiat currency instability.
🎯 $117,500 Level in Focus. Analysts are unanimously emphasizing this level. A breach would serve as technical confirmation of a major rally beginning towards $122,000, creating a self-fulfilling prophecy effect as many traders will place their orders just beyond this mark.
🏛️ Fed Uncertainty. Experts are divided on the impact of the upcoming Fed interest rate decision. This is the primary source of potential volatility this week. The decision could either accelerate growth (in case of policy easing) or trigger a short-term correction.
🇷🇺 Russian Legalization. Sberbank, Russia's largest bank, launching a financial asset pegged to a basket of Bitcoin and Ethereum is a huge step towards cryptocurrency adoption in Russia and a signal for major capital.
🔮 FORECAST AND KEY TARGETS FOR THE WEEK (September 17-24)
The technical picture, order book analysis, and positive news flow create all the conditions for continued upward movement. The main risk is the uncertainty surrounding the Fed meeting. A breakthrough of the current consolidation upwards will open the way to the week's main targets.
Scenario Probability: Long 📈 (70%) / Short 📉 (30%)
🎯 Key Targets for the Upcoming Week:
UP Targets (in case of consolidation breakout):
🐂 117,500 USDT - Technical and psychological trigger for the main growth wave.
🐂🐂 119,800 USDT - Next profit-taking zone before the important 120k level.
🐂🐂🐂 122,000 USDT - Optimistic weekly target, based on graphical model projections.
DOWN Targets (in case of false breakout and correction):
🐻 115,800 USDT - Mirrored level, former resistance, now the first strong support.
🐻🐻 115,000 USDT - Psychological mark and a zone where buyer activity was observed yesterday.
🐻🐻🐻 114,200 USDT - Key support on the 4H chart; its loss could break the bullish structure.
💡 TRADING IDEAS
Long Positions (Long) — With the Trend.
Long Idea 1 (Aggressive): Buy on a breakout of the upper boundary of the current consolidation (above 116,800 USDT). Target: 117,500. Stop-loss: 116,350 USDT.
Long Idea 2 (Conservative): Buy on a retest of the 115,800 - 116,000 USDT support zone if the market pulls back. Targets: 117,500, 119,800 USDT. Stop-loss: 115,400 USDT.
Short Positions (Short) — Against the Wind.
Short Idea 1 (Risky): Sell only if a clear false breakout of the 117,500 level forms. For example, a sharp rise followed by an equally sharp drop back below this level. Target: 116,000. Stop-loss: 117,950 USDT.
Short Idea 2 (Structural Break): Short only if there's a confident break and consolidation below the strong 115,800 USDT support. This would signal that all of yesterday's growth was a bull trap. Targets: 115,000, 114,200 USDT. Stop-loss: 116,300 USDT.
🛡️ CONCLUSION AND RECOMMENDATIONS
The market is clearly under bull control. Price structure, sentiment, and news flow all point towards continued growth. The coming hours will reveal whether the current pause was an accumulation of strength before a new assault. I recommend trading with the trend but being prepared for increased volatility around Fed news days. Always use stop-losses 🛡️ — they are your best defense in the world of crypto!
May your trades be green and your profits cosmic! 💰 Don't forget to give this analysis a thumbs up 👍 and subscribe to always stay one step ahead of the market!

Related publications
Disclaimer
The information and publications are not meant to be, and do not constitute, financial, investment, trading, or other types of advice or recommendations supplied or endorsed by TradingView. Read more in the Terms of Use.
Related publications
Disclaimer
The information and publications are not meant to be, and do not constitute, financial, investment, trading, or other types of advice or recommendations supplied or endorsed by TradingView. Read more in the Terms of Use.