
BTC/USD
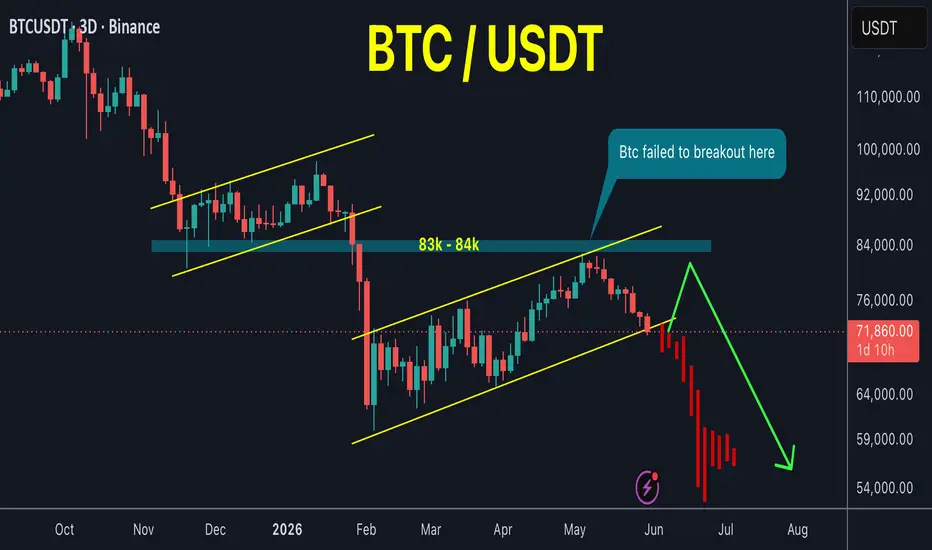
Bitcoin's price has formed another bearish flag pattern similar to the previous one.
Bitcoin has been trading within this bearish pattern for four months, and a break below it would likely lead to a price drop to a previous low or lower.
Since the top in October , the price appears to have failed to make any bullish break out, suggesting that Bitcoin will continue to decline more sooner or later until there is real trend shift in market structure
Scenario 1 and 2 both bearish now in my chart
Bitcoin's price has formed another bearish flag pattern similar to the previous one.
Bitcoin has been trading within this bearish pattern for four months, and a break below it would likely lead to a price drop to a previous low or lower.
Since the top in October , the price appears to have failed to make any bullish break out, suggesting that Bitcoin will continue to decline more sooner or later until there is real trend shift in market structure
Scenario 1 and 2 both bearish now in my chart
Trade active
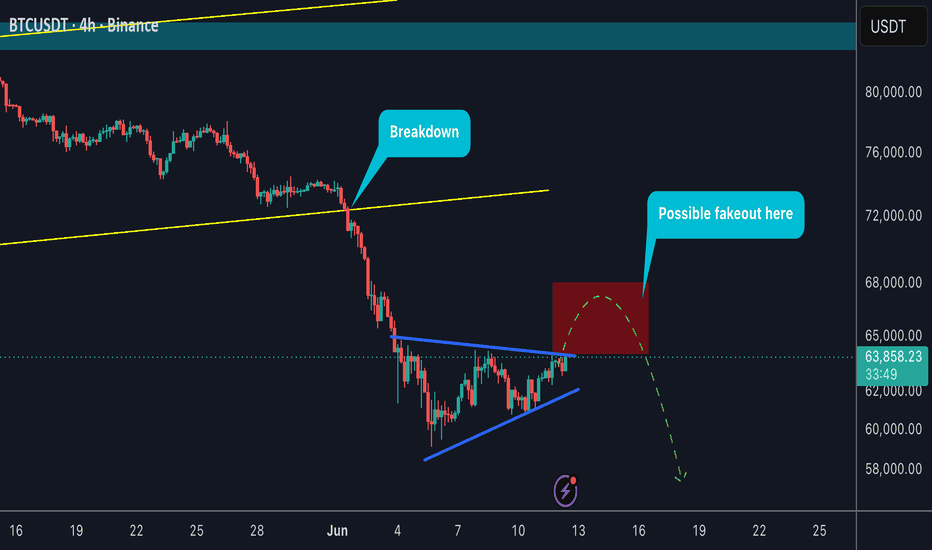
BTC just hit 68k ☑️Trade closed: target reached
The price dropped sharply a few hours after my analysis. Note
Update :Note
Bitcoin reached $60,000 for the first time after four months of accumulation within this bearish pattern, as I predicted in my analysis.Note
New update released For full details Check here : 👇

🔷 Telegram channel: t.me/bitcoin_masters
💸☎️ For Premium Signals Group ask me here: t.me/Babenski
💸☎️ For Premium Signals Group ask me here: t.me/Babenski
Related publications
Disclaimer
The information and publications are not meant to be, and do not constitute, financial, investment, trading, or other types of advice or recommendations supplied or endorsed by TradingView. Read more in the Terms of Use.
🔷 Telegram channel: t.me/bitcoin_masters
💸☎️ For Premium Signals Group ask me here: t.me/Babenski
💸☎️ For Premium Signals Group ask me here: t.me/Babenski
Related publications
Disclaimer
The information and publications are not meant to be, and do not constitute, financial, investment, trading, or other types of advice or recommendations supplied or endorsed by TradingView. Read more in the Terms of Use.