
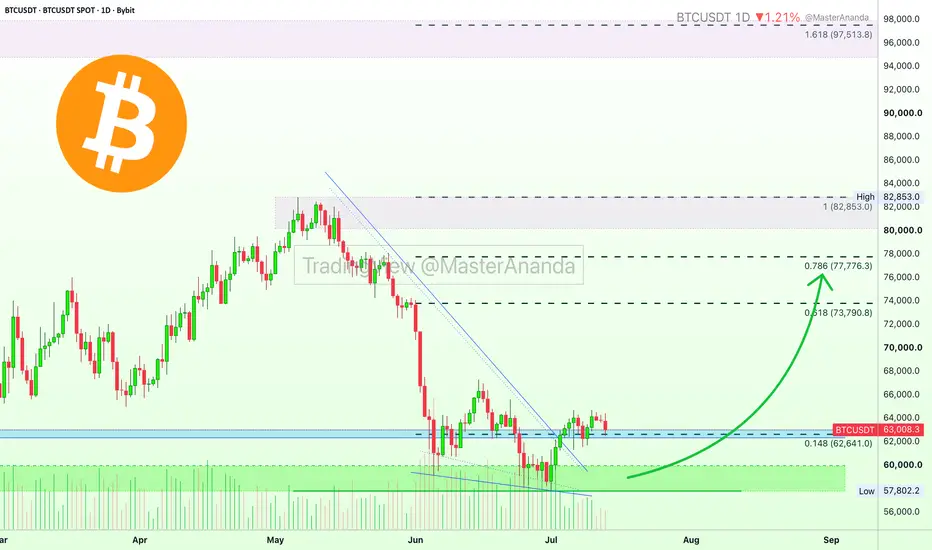
Bitcoin is set to continue rising. Bitcoin's rise will start massive growth across the altcoins market in the coming months. Bitcoin is set to grow for months.
Notice how consolidation is happening above support. Back in 2025, Bitcoin peaked first sometime around July, then it went on to consolidate for about three months below resistance, the all-time high. The confirmation of resistance led to a major crash, a bearish cycle. The situation has been reversed.
The support in question is a range between $58,000 and $62,000. Back in 2025, the resistance in question was also a range, between $120,000 and $125,000. Things are better now.
The three months (3) long bearish consolidation led to a strong correction which we just experienced. The bullish consolidation period has been going for five months and a half (5.5). The consolidation and accumulation phase above support has been going much longer than the consolidation below resistance. This in turn can support a much longer bullish cycle or bullish market. Based on the bigger picture, Bitcoin will grow for years to come.
The next move can least several months, 1-3 months. That is, higher highs and higher lows until September or October 2026 before we witness any type of major correction. From now on, all corrections will result in higher lows. The market bottom can be set at the low hit early this month—$57,800.
Good news is coming. Prepare for the best.
Thank you for reading.
Namaste.
Notice how consolidation is happening above support. Back in 2025, Bitcoin peaked first sometime around July, then it went on to consolidate for about three months below resistance, the all-time high. The confirmation of resistance led to a major crash, a bearish cycle. The situation has been reversed.
The support in question is a range between $58,000 and $62,000. Back in 2025, the resistance in question was also a range, between $120,000 and $125,000. Things are better now.
The three months (3) long bearish consolidation led to a strong correction which we just experienced. The bullish consolidation period has been going for five months and a half (5.5). The consolidation and accumulation phase above support has been going much longer than the consolidation below resistance. This in turn can support a much longer bullish cycle or bullish market. Based on the bigger picture, Bitcoin will grow for years to come.
The next move can least several months, 1-3 months. That is, higher highs and higher lows until September or October 2026 before we witness any type of major correction. From now on, all corrections will result in higher lows. The market bottom can be set at the low hit early this month—$57,800.
Good news is coming. Prepare for the best.
Thank you for reading.
Namaste.
Note
As you can see here, Bitcoin entered its all-time high range last year around July 2025, then went sideways until October. Growth ended in July and it took three months before the start of the bear market correction. Seeing the first peak around July 2025, we can start to look for a bear market bottom, the end of the corrective period, around July 2026—this month.
The triple bottom and confirmation of $60,000 as support can lend strength to this perspective. MA200 weekly, the 0.618 Fib. retracement level around $57,772 that I showed in my previous analysis, the lowest reading ever on the daily RSI; all these work to support a bear market being over...
Trade active
Now we can perform the same exercise but in reverse.Bitcoin first hit bottom around February 2026, it then moved to produce a mild bullish wave. After three months of bullish action, a correction led to a test of the previous low as support around $60,000. So far, this support level has been tested twice.
The first challenge happened June 2026 with a low of $59,000, Bitcoin recovered.
The second challenge happened this month, July 2026, with a low of $57,800, Bitcoin recovered. Notice the similarities.
Bitcoin peaked last year first around $120,000 then produced several shy higher highs, a triple top followed by the bear market wave.
Bitcoin hit bottom this year first around $60,000 then produced several shy lower lows, a triple bottom, followed by a bull market wave?
The signals are in... The market is set to recover.
The fact that we have shy lower lows, means that buyers are present at support. Each time strong selling happens, everything that is sold is being bought. Support holds is good for the bulls. Bitcoin is extremely bullish above $60,000.
Thank you for reading.
Namaste.
Note
Prior to June 2026 Bitcoin hit its lowest level on the daily RSI in August 2023. After this extreme reading, oversold, BTCUSDT grew until March 2024.The extreme oversold reading already happened twice this year, both lower than August 2023. In February and June 2026 Bitcoin entered oversold territory on the daily RSI. This signal points to a bull market developing next, long-term growth; higher highs and higher lows.
Namaste.
Note
The Cryptocurrency market Open Interest (OI) has a perfect bullish chart structure. It seems it is about to go up really strong. A sudden jump. Note
Long/Short Ratio Accounts (this one needs no explanation)Here comes the explanation!
Clearly we had a downtrend before May 2026, afterward we have an uptrend. The market is turning bullish, gradually, slowly; long-term.
The transition period is quite pronounced and it lasted several months. This is a very strong signal/indicator, it shouldn't be ignored. Bitcoin is going up!
Note
Long Short Accounts %As the market turns bullish, the percentage of accounts that are bearish vs those that are bullish is changing, let me give you an example:
» In early May, only 33% of the accounts were bullish (long), while 66% were bearish (short).
» In early July, we now have around 35.5% of accounts being bearish (short), while 64.5% are bullish (long).
This is a huge change. See the chart:
This is just a friendly reminder, Bitcoin is going up!
Namaste.

💯 TOP Results (Sept 2026) 👇
t.me/masteranandatrades/9279
🔥 10-25X Leverage, Results & Profits
t.me/masteranandatrades/9271
✅ 4 PREMIUM Telegram channels special offer
—One-Time Payment! (🔝 since 2017)
t.me/lamatrades/4
t.me/masteranandatrades/9279
🔥 10-25X Leverage, Results & Profits
t.me/masteranandatrades/9271
✅ 4 PREMIUM Telegram channels special offer
—One-Time Payment! (🔝 since 2017)
t.me/lamatrades/4
Related publications
Disclaimer
The information and publications are not meant to be, and do not constitute, financial, investment, trading, or other types of advice or recommendations supplied or endorsed by TradingView. Read more in the Terms of Use.
💯 TOP Results (Sept 2026) 👇
t.me/masteranandatrades/9279
🔥 10-25X Leverage, Results & Profits
t.me/masteranandatrades/9271
✅ 4 PREMIUM Telegram channels special offer
—One-Time Payment! (🔝 since 2017)
t.me/lamatrades/4
t.me/masteranandatrades/9279
🔥 10-25X Leverage, Results & Profits
t.me/masteranandatrades/9271
✅ 4 PREMIUM Telegram channels special offer
—One-Time Payment! (🔝 since 2017)
t.me/lamatrades/4
Related publications
Disclaimer
The information and publications are not meant to be, and do not constitute, financial, investment, trading, or other types of advice or recommendations supplied or endorsed by TradingView. Read more in the Terms of Use.