
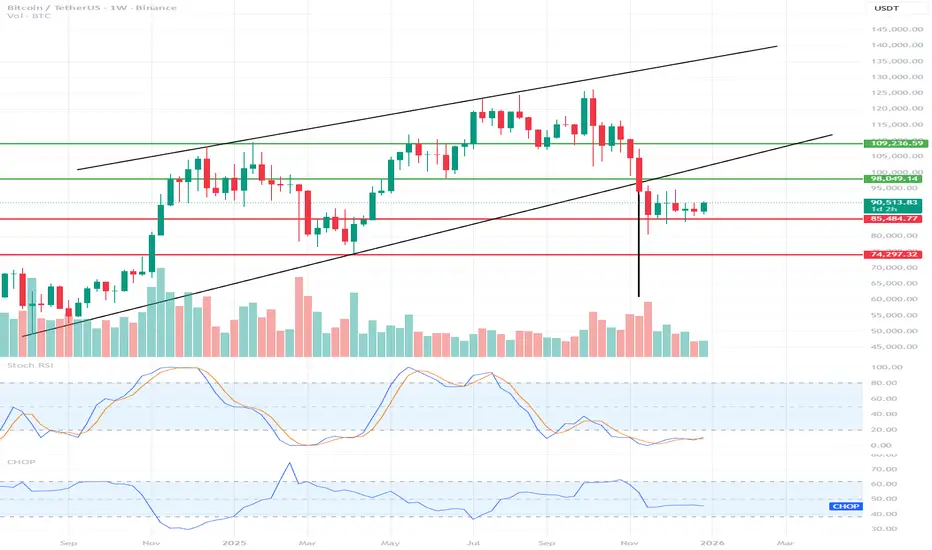
🔍 Market Structure
For many months, the uptrend has been in a channel – clear higher highs and higher lows.
A breakout from the uptrend channel → indicates a change in market structure (BOS) to weekly.
The current move is a correction after a downward impulse, not a new uptrend.
➡️ HTF Bias: BEARISH / Corrective
🧱 Key Levels
🟢 Resistance (now resistance)
98,000 – 100,000 → former support, currently flipping to resistance
109,000 → strong weekly supply / EQ of the previous range
~125,000 → upper band of the old channel (unrealistic without a change in structure)
🔴 Support
85,400 → current reaction zone (local demand)
74,300 → key weekly demand, a very important level
Below: ~68–70k (another HTF zone – not marked, but logical)
📉 Price Action
Strong, impulsive bearish candle + long lower wick → liquidations + panic sell
No strong upward momentum after the rebound → weak demand
Current move = bear flag / bear range
➡️ This does NOT look like the end of the correction.
📊 Volume
High volume on the decline → distribution
Declining volume on the bounce → no real buyers
➡️ Classic pattern: dump → weak bounce → continuation
📈 Indicators
Stochastic RSI (W1)
In the oversold zone, but:
No strong bullish cross + no price impulse
➡️ May grind low for many weeks
CHOP
Falling → market preparing for a bigger move
Direction still more down than up
🧠 Scenarios
🟥 Baseline scenario (most likely)
Rejection 98-100k
Return to 85k
Test 74k
Only then the decision is made: bounce vs. Deeper bear market
🟩 Alternative scenario (less likely)
Weekly close above 100k
Retest of 98k as support
Only then can we consider 109k
❗ Key takeaways
❌ This is not a good time to go long on HTF
❌ The current rebound is a pullback, not a reversal
✅ Shorts only on retests of resistance
✅ Spot DCA only makes sense at 74k ±
For many months, the uptrend has been in a channel – clear higher highs and higher lows.
A breakout from the uptrend channel → indicates a change in market structure (BOS) to weekly.
The current move is a correction after a downward impulse, not a new uptrend.
➡️ HTF Bias: BEARISH / Corrective
🧱 Key Levels
🟢 Resistance (now resistance)
98,000 – 100,000 → former support, currently flipping to resistance
109,000 → strong weekly supply / EQ of the previous range
~125,000 → upper band of the old channel (unrealistic without a change in structure)
🔴 Support
85,400 → current reaction zone (local demand)
74,300 → key weekly demand, a very important level
Below: ~68–70k (another HTF zone – not marked, but logical)
📉 Price Action
Strong, impulsive bearish candle + long lower wick → liquidations + panic sell
No strong upward momentum after the rebound → weak demand
Current move = bear flag / bear range
➡️ This does NOT look like the end of the correction.
📊 Volume
High volume on the decline → distribution
Declining volume on the bounce → no real buyers
➡️ Classic pattern: dump → weak bounce → continuation
📈 Indicators
Stochastic RSI (W1)
In the oversold zone, but:
No strong bullish cross + no price impulse
➡️ May grind low for many weeks
CHOP
Falling → market preparing for a bigger move
Direction still more down than up
🧠 Scenarios
🟥 Baseline scenario (most likely)
Rejection 98-100k
Return to 85k
Test 74k
Only then the decision is made: bounce vs. Deeper bear market
🟩 Alternative scenario (less likely)
Weekly close above 100k
Retest of 98k as support
Only then can we consider 109k
❗ Key takeaways
❌ This is not a good time to go long on HTF
❌ The current rebound is a pullback, not a reversal
✅ Shorts only on retests of resistance
✅ Spot DCA only makes sense at 74k ±

Disclaimer
The information and publications are not meant to be, and do not constitute, financial, investment, trading, or other types of advice or recommendations supplied or endorsed by TradingView. Read more in the Terms of Use.
Disclaimer
The information and publications are not meant to be, and do not constitute, financial, investment, trading, or other types of advice or recommendations supplied or endorsed by TradingView. Read more in the Terms of Use.