
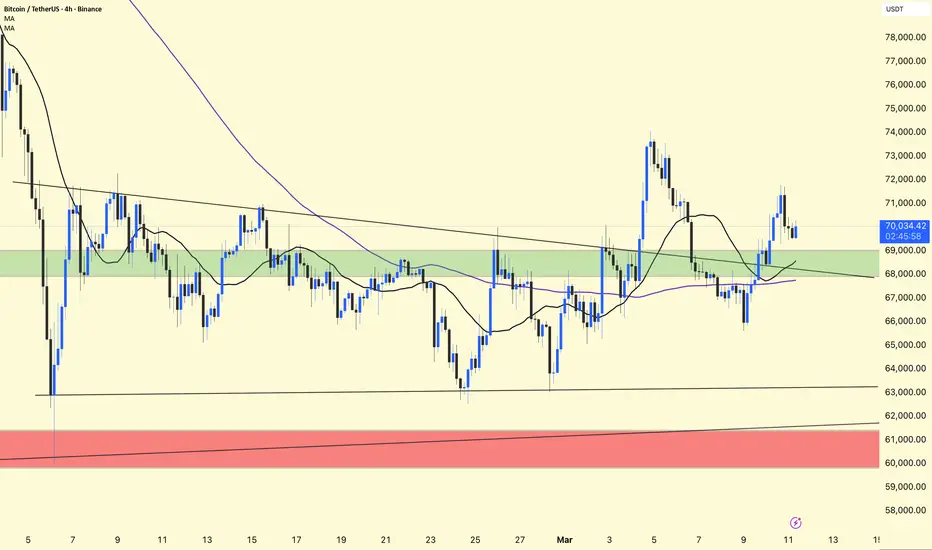
BTC/USDT – 4H Chart Update
Bitcoin is currently trading near $70K, holding above a key **support zone around $68K–$69K
* Price reclaimed the **green demand zone** and is now consolidating above it.
* The **short-term moving averages** are starting to curl upward, showing improving momentum.
* However, the **descending trendline resistance** from previous highs is still above the price.
📈 Bullish Scenario:
If BTC holds above $68K, buyers may push the price toward:
$71K – $72K resistance
Potential breakout target near $74K
📉 Bearish Scenario:
Losing $68K support could send BTC back to:
$63K support
Major demand zone around $60K–$61K
BTC is in a short-term recovery phase, but it still needs to break the descending resistance to confirm stronger upside momentum.
Bitcoin is currently trading near $70K, holding above a key **support zone around $68K–$69K
* Price reclaimed the **green demand zone** and is now consolidating above it.
* The **short-term moving averages** are starting to curl upward, showing improving momentum.
* However, the **descending trendline resistance** from previous highs is still above the price.
📈 Bullish Scenario:
If BTC holds above $68K, buyers may push the price toward:
$71K – $72K resistance
Potential breakout target near $74K
📉 Bearish Scenario:
Losing $68K support could send BTC back to:
$63K support
Major demand zone around $60K–$61K
BTC is in a short-term recovery phase, but it still needs to break the descending resistance to confirm stronger upside momentum.

Related publications
Disclaimer
The information and publications are not meant to be, and do not constitute, financial, investment, trading, or other types of advice or recommendations supplied or endorsed by TradingView. Read more in the Terms of Use.
Related publications
Disclaimer
The information and publications are not meant to be, and do not constitute, financial, investment, trading, or other types of advice or recommendations supplied or endorsed by TradingView. Read more in the Terms of Use.