
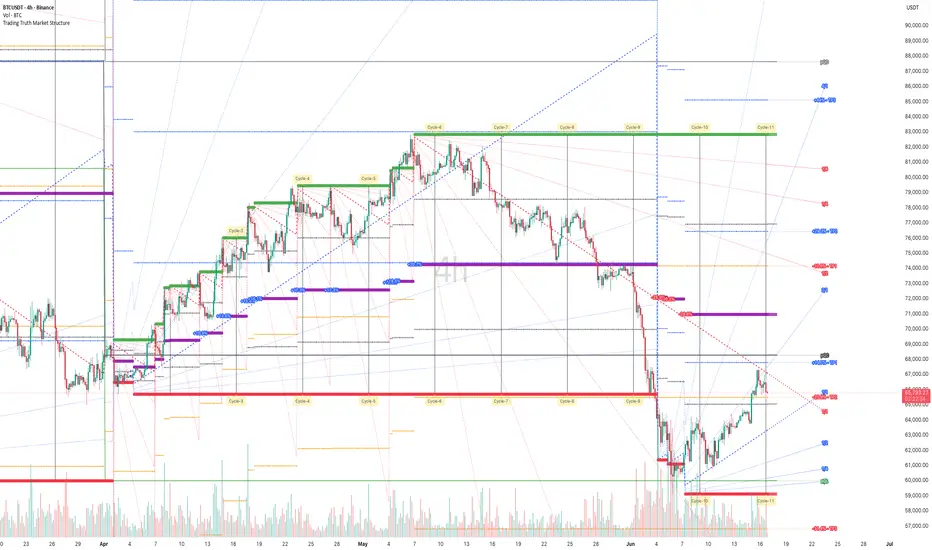
📊 BTCUSDT (4H Timeframe)
🔍 Analysis:
• Strong recovery from the Cycle-10 low after a capitulation selloff ✅
• Price is respecting the ascending 1x1 geometric angle support ✅
• Higher lows continue to form, showing improving market structure ✅
• BTC is currently testing a key confluence zone near the descending 1x1 resistance ⚠️
• Break above the descending geometric angle could trigger the next expansion leg 🚀
• HTF midpoint around 65,000 remains the critical battleground level 📐
• Time-cycle projection suggests increased volatility approaching the next cycle node ⏳
🎯 Bullish Targets:
✅ TP1: 68,500
✅ TP2: 71,000
✅ TP3: 73,500
✅ TP4: 78,000
📌 Support Zone:
64,000 – 65,000
🛑 Stop Loss:
Below 62,500
🚀 Trade Idea:
BUY on pullbacks into the 64,000–65,000 support region or on a confirmed breakout above the descending geometric resistance.
📈 Outlook:
As long as BTC remains above the 1x1 ascending angle and the 64,000 support zone, buyers maintain control. A breakout through the current geometric resistance could open the path toward 68,500 first, followed by 71,000 and potentially 73,500–78,000 as the next cycle expansion unfolds.
🔍 Analysis:
• Strong recovery from the Cycle-10 low after a capitulation selloff ✅
• Price is respecting the ascending 1x1 geometric angle support ✅
• Higher lows continue to form, showing improving market structure ✅
• BTC is currently testing a key confluence zone near the descending 1x1 resistance ⚠️
• Break above the descending geometric angle could trigger the next expansion leg 🚀
• HTF midpoint around 65,000 remains the critical battleground level 📐
• Time-cycle projection suggests increased volatility approaching the next cycle node ⏳
🎯 Bullish Targets:
✅ TP1: 68,500
✅ TP2: 71,000
✅ TP3: 73,500
✅ TP4: 78,000
📌 Support Zone:
64,000 – 65,000
🛑 Stop Loss:
Below 62,500
🚀 Trade Idea:
BUY on pullbacks into the 64,000–65,000 support region or on a confirmed breakout above the descending geometric resistance.
📈 Outlook:
As long as BTC remains above the 1x1 ascending angle and the 64,000 support zone, buyers maintain control. A breakout through the current geometric resistance could open the path toward 68,500 first, followed by 71,000 and potentially 73,500–78,000 as the next cycle expansion unfolds.

Disclaimer
The information and publications are not meant to be, and do not constitute, financial, investment, trading, or other types of advice or recommendations supplied or endorsed by TradingView. Read more in the Terms of Use.
Disclaimer
The information and publications are not meant to be, and do not constitute, financial, investment, trading, or other types of advice or recommendations supplied or endorsed by TradingView. Read more in the Terms of Use.