
Triangles are a trader’s best friend and worst nightmare.
They are notorious for driving technical analysts crazy. Why? Because while a triangle is forming, it looks exactly the same whether the market is preparing for a massive bullish breakout or setting a deadly trap for buyers.
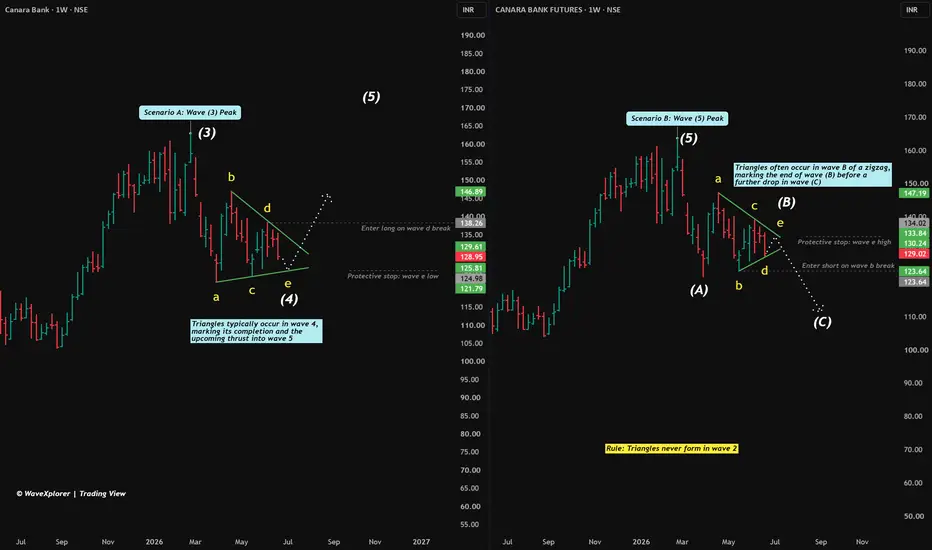
To have different triangle notations, I have used Canara Bank spot chart on the left panel and the Futures chart on the right panel.
Look at the chart. We have a tightening squeeze with five sub-waves (a-b-c-d-e). It looks identical on both sides, but it can play out in two completely opposite ways.
Let’s break down the two faces of the triangle—and exactly how to trade them without guessing the direction.
The Two Faces of the Triangle
Scenario A: The Wave Four Launchpad (Bullish)
In a healthy uptrend, a triangle often shows up as Wave Four.
Scenario B: The Wave B Bull Trap (Bearish)
Sometimes, the big upward trend is already over (Wave Five peak), and the market is entering a major correction.
How to Trade It: Stop Predicting, Start Trapping!
Don't waste your time or money trying to guess if Canara Bank is in Scenario A or Scenario B. Instead, react to the market by setting a trap on both sides.
Here is your mechanical, stress-free execution plan using key structural levels:
The Long Entry (Buying the Breakout)
The Short Entry (Buying the Crash)
Summary
By letting the market break wave d or wave b levels, you completely eliminate the guessing game.
Disclaimer: This post is for educational purposes only and is not financial advice.
They are notorious for driving technical analysts crazy. Why? Because while a triangle is forming, it looks exactly the same whether the market is preparing for a massive bullish breakout or setting a deadly trap for buyers.
To have different triangle notations, I have used Canara Bank spot chart on the left panel and the Futures chart on the right panel.
Look at the chart. We have a tightening squeeze with five sub-waves (a-b-c-d-e). It looks identical on both sides, but it can play out in two completely opposite ways.
Let’s break down the two faces of the triangle—and exactly how to trade them without guessing the direction.
The Two Faces of the Triangle
Scenario A: The Wave Four Launchpad (Bullish)
In a healthy uptrend, a triangle often shows up as Wave Four.
- The Story: The market just made a powerful run (Wave Three) and needs to catch its breath. Big players are slowly accumulating shares without pushing the price too high.
- The Result: Once the triangle finishes at wave e, the price violently explodes upward to make a brand-new high (Wave Five).
Scenario B: The Wave B Bull Trap (Bearish)
Sometimes, the big upward trend is already over (Wave Five peak), and the market is entering a major correction.
- The Story: The market drops hard (Wave A). Then, a triangle forms as Wave B. This is a deceptive sideways move designed to trick retail traders into thinking the bull market is back.
- The Result: Once wave e finishes, the floor drops out, and the price crashes into a punishing Wave C decline.
The Golden Exclusion Rule
Before you look for a triangle, remember this core rule: Triangles never form in Wave Two. If you see a triangle right after a major trend begins, it is not a Wave Two. This rule alone will save you from countless bad trades.
How to Trade It: Stop Predicting, Start Trapping!
Don't waste your time or money trying to guess if Canara Bank is in Scenario A or Scenario B. Instead, react to the market by setting a trap on both sides.
Here is your mechanical, stress-free execution plan using key structural levels:
The Long Entry (Buying the Breakout)
- The Trigger: Wait for the price to break above the wave d peak.
- Why it works: Breaking this level proves the sequence of lower highs is broken. This officially triggers the move to Wave Five.
- Safety Net (Stop Loss): Place it just below the wave e low.
The Short Entry (Buying the Crash)
- The Trigger: Wait for the price to break below the wave b floor.
- Why it works: Many traders get faked out by simple trendline breaks. By waiting for the actual wave b structural floor to snap, you confirm the entire triangle has collapsed into Wave C.
- Safety Net (Stop Loss): Place it just above the wave e high.
Summary
By letting the market break wave d or wave b levels, you completely eliminate the guessing game.
Disclaimer: This post is for educational purposes only and is not financial advice.

WaveXplorer | Elliott Wave insights
📊 X profile: @veerappa89
📊 X profile: @veerappa89
Related publications
Disclaimer
The information and publications are not meant to be, and do not constitute, financial, investment, trading, or other types of advice or recommendations supplied or endorsed by TradingView. Read more in the Terms of Use.
WaveXplorer | Elliott Wave insights
📊 X profile: @veerappa89
📊 X profile: @veerappa89
Related publications
Disclaimer
The information and publications are not meant to be, and do not constitute, financial, investment, trading, or other types of advice or recommendations supplied or endorsed by TradingView. Read more in the Terms of Use.