
CESC Ltd – Head & Shoulders Reversal Watch
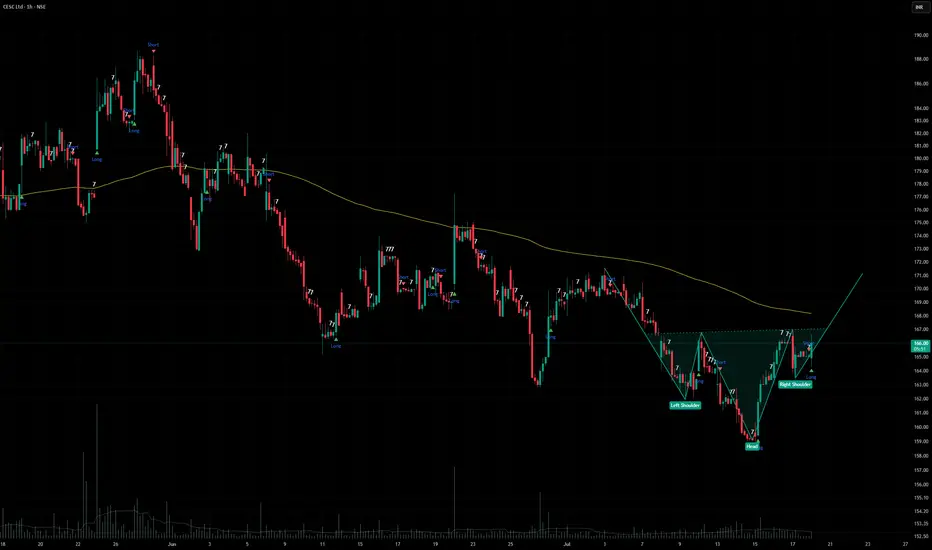
Setup: 1‑hour chart showing a Head & Shoulders formation with neckline in play.
Current Price Zone: ₹158 – ₹190.
Trend Context:
Left Shoulder, Head, Right Shoulder clearly defined.
Moving average providing dynamic support.
Long/Short signals marking trader interest.
Why Traders Care:
Head & Shoulders is a classic reversal pattern.
Break below neckline often signals bearish momentum.
Volume spikes add conviction to whichever side confirms.
My Take: CESC Ltd is flashing a potential reversal — sustaining below neckline could trigger downside, while holding above may invalidate the setup.
Setup: 1‑hour chart showing a Head & Shoulders formation with neckline in play.
Current Price Zone: ₹158 – ₹190.
Trend Context:
Left Shoulder, Head, Right Shoulder clearly defined.
Moving average providing dynamic support.
Long/Short signals marking trader interest.
Why Traders Care:
Head & Shoulders is a classic reversal pattern.
Break below neckline often signals bearish momentum.
Volume spikes add conviction to whichever side confirms.
My Take: CESC Ltd is flashing a potential reversal — sustaining below neckline could trigger downside, while holding above may invalidate the setup.

Sucrit.D.Patil
Disclaimer
The information and publications are not meant to be, and do not constitute, financial, investment, trading, or other types of advice or recommendations supplied or endorsed by TradingView. Read more in the Terms of Use.
Sucrit.D.Patil
Disclaimer
The information and publications are not meant to be, and do not constitute, financial, investment, trading, or other types of advice or recommendations supplied or endorsed by TradingView. Read more in the Terms of Use.