
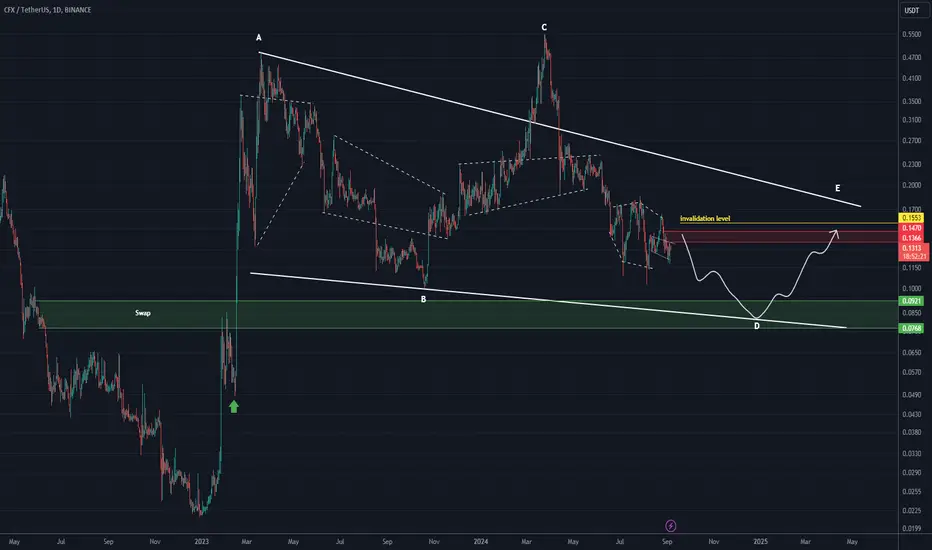
From where we put the red arrow on the chart, it looks like CFX is forming a big triangle, and we are now in the middle of wave D of this triangle.
Wave D looks like a diamond diametric. It seems that we are in the middle of the F wave of this diametric.
It can move from the red box to the green box.
We are looking for sell/short positions in the supply range.
We are looking for buy/long positions in the green range.
Closing a daily candle above the invalidation level will violate the analysis.
For risk management, please don't forget stop loss and capital management
Comment if you have any questions
Thank You
Wave D looks like a diamond diametric. It seems that we are in the middle of the F wave of this diametric.
It can move from the red box to the green box.
We are looking for sell/short positions in the supply range.
We are looking for buy/long positions in the green range.
Closing a daily candle above the invalidation level will violate the analysis.
For risk management, please don't forget stop loss and capital management
Comment if you have any questions
Thank You

✅ Join our Telegram channel to succeed in crypto trading.
💎Our CRYPTO Telegram Channel: 👉 t.me/Behdark_EN
💎Our FOREX Telegram Channel: 👉 t.me/FX_Behdark
💎Our CRYPTO Telegram Channel: 👉 t.me/Behdark_EN
💎Our FOREX Telegram Channel: 👉 t.me/FX_Behdark
Disclaimer
The information and publications are not meant to be, and do not constitute, financial, investment, trading, or other types of advice or recommendations supplied or endorsed by TradingView. Read more in the Terms of Use.
✅ Join our Telegram channel to succeed in crypto trading.
💎Our CRYPTO Telegram Channel: 👉 t.me/Behdark_EN
💎Our FOREX Telegram Channel: 👉 t.me/FX_Behdark
💎Our CRYPTO Telegram Channel: 👉 t.me/Behdark_EN
💎Our FOREX Telegram Channel: 👉 t.me/FX_Behdark
Disclaimer
The information and publications are not meant to be, and do not constitute, financial, investment, trading, or other types of advice or recommendations supplied or endorsed by TradingView. Read more in the Terms of Use.