
**CHENNAI PETROLEUM CORPORATION LTD (CPCL) — Monthly + Weekly Multi-Timeframe Analysis**
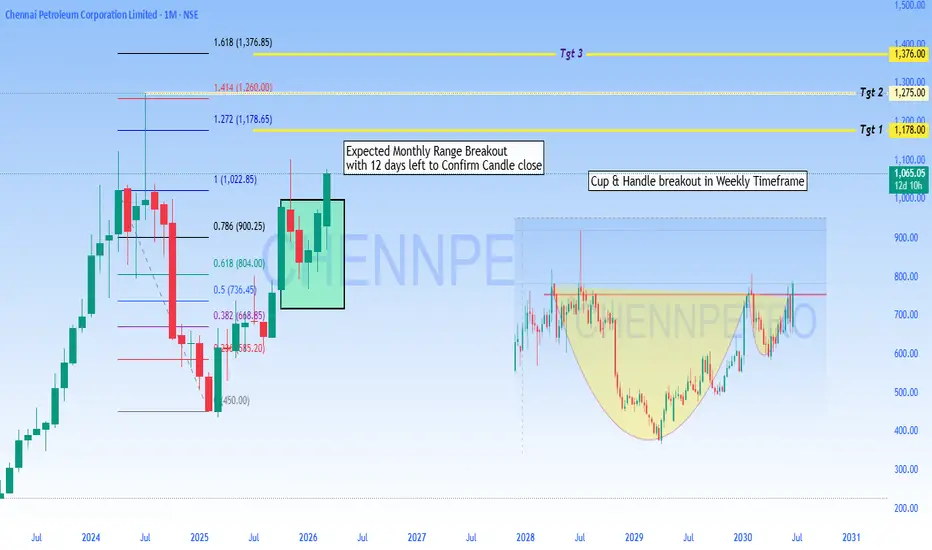
CPCL is currently trading at **₹1,065**, breaking out above the **1.0 Fibonacci extension (₹1,022.85)** on the monthly chart, with **12 days remaining** to confirm the monthly candle close.
**Monthly Timeframe — Fibonacci Breakout:**
- Price bottomed near **₹450** in early 2025 and has since staged a powerful recovery
- Currently breaking out of a highlighted consolidation zone (green box)
- Monthly close above ₹1,022 confirms continuation toward:
- **Tgt 1 — ₹1,178** (1.272 extension)
- **Tgt 2 — ₹1,275** (1.414 extension)
- **Tgt 3 — ₹1,376** (1.618 extension)
**Weekly Timeframe — Cup & Handle Pattern:**
- A large **Cup & Handle formation** is projected on the weekly chart spanning approximately **2028–2030**
- The cup bottom is projected around **₹400**, with the handle forming near **₹750–800**
- A breakout from this pattern would set up a much larger long-term move, confirming the bullish macro structure
**Key Takeaway:**
Two powerful patterns aligning across timeframes — a **near-term Fibonacci breakout** on the monthly, and a **longer-term Cup & Handle** on the weekly — both pointing toward sustained bullish momentum for CPCL over the coming years.
**Bias:** Strongly bullish on both short and long-term timeframes, subject to monthly candle confirmation.
Disclaimer:
The analysis and chart shared here is purely for educational and informational purposes only and should not be construed as financial, investment, or trading advice. I am not a SEBI-registered research analyst or financial advisor.
The views expressed are based on personal technical analysis and are subject to change without notice. Past performance of any stock is not indicative of future results.
Investing in the stock market involves substantial risk of loss. Please do your own due diligence and consult a certified financial advisor before making any investment decisions.
I hold no responsibility for any profit or loss arising from the use of this information. Trade and invest at your own risk.

Disclaimer
The information and publications are not meant to be, and do not constitute, financial, investment, trading, or other types of advice or recommendations supplied or endorsed by TradingView. Read more in the Terms of Use.
Disclaimer
The information and publications are not meant to be, and do not constitute, financial, investment, trading, or other types of advice or recommendations supplied or endorsed by TradingView. Read more in the Terms of Use.