
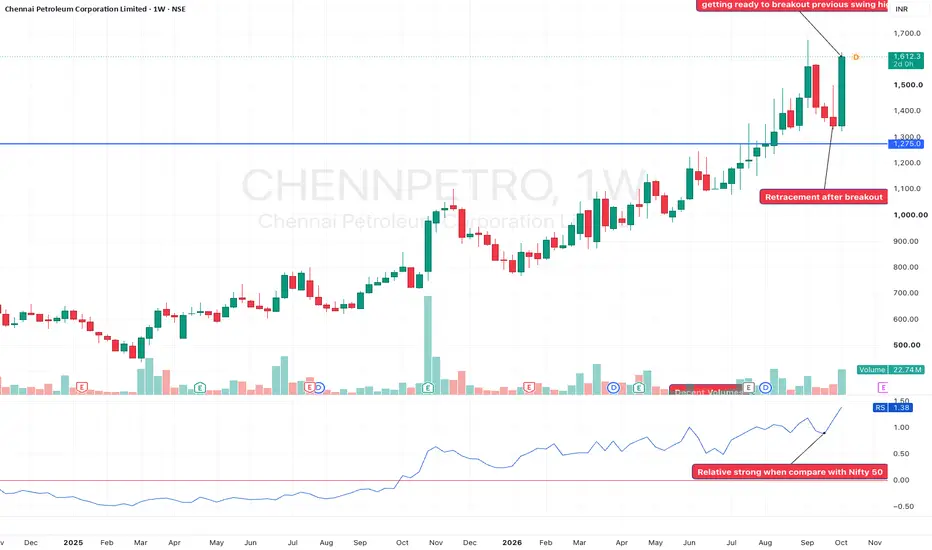
CHENNPETRO All-Time High Breakout
🔥 A clean example of a All-Time High Breakout → Momentum Continuation setup!
One of the patterns I like watching is how a stock behaves when it finally breaks a major historical resistance after spending a long time below it.
In CHENNPETRO, the structure was quite interesting:
📌 Step 1 – Major Resistance
The ₹1,275 zone acted as a major resistance level and marked the previous All-Time High on the chart.
After a strong recovery from the lower levels, price gradually moved towards this resistance zone.
📌 Step 2 – Breakout
Price finally broke above ₹1,275 with strong momentum.
The important part here was that the stock didn't just make a marginal move above resistance. It started showing strong follow-through after the breakout.
📌 Step 3 – Momentum Expansion
Once the previous ATH was cleared, the stock entered price discovery territory.
With no major historical resistance above ₹1,275, the stock started making a series of Higher Highs and Higher Lows, leading to a sharp momentum move.
📌 Step 4 – Pullback & Continuation
After the strong rally, the stock witnessed a sharp pullback from the recent highs.
But instead of completely losing the breakout structure, buyers stepped in again and pushed the stock back towards the highs.
This is the kind of price action I like to watch:
Breakout → Momentum → Pullback → Buyers step in → Continuation
📌 What I am watching now
The ₹1,275 breakout zone remains an important structural level.
As long as the stock continues to hold well above the major breakout zone and maintains the Higher High–Higher Low structure, the broader momentum setup remains interesting.
The next important observation would be how price behaves around the recent ATH zone.
A decisive breakout above the recent high could potentially lead to another phase of price discovery.
⚠️ At the same time, after such a sharp move, chasing the stock at elevated levels comes with higher risk. I would rather watch for healthy consolidation or a controlled pullback than blindly chase a large green candle.
This is exactly why I like studying breakout charts — the breakout itself is only one part of the setup. What happens AFTER the breakout is equally important.
What do you think about CHENNPETRO at these levels? 👇
Breakout → Retest/Consolidation → Continuation?
#CHENNPETRO #ChennaiPetroleum #Breakout #AllTimeHigh #MomentumTrading #PriceAction #SwingTrading #TechnicalAnalysis #NSE #IndianStocks
Educational purpose only. Not a buy/sell recommendation.
🔥 A clean example of a All-Time High Breakout → Momentum Continuation setup!
One of the patterns I like watching is how a stock behaves when it finally breaks a major historical resistance after spending a long time below it.
In CHENNPETRO, the structure was quite interesting:
📌 Step 1 – Major Resistance
The ₹1,275 zone acted as a major resistance level and marked the previous All-Time High on the chart.
After a strong recovery from the lower levels, price gradually moved towards this resistance zone.
📌 Step 2 – Breakout
Price finally broke above ₹1,275 with strong momentum.
The important part here was that the stock didn't just make a marginal move above resistance. It started showing strong follow-through after the breakout.
📌 Step 3 – Momentum Expansion
Once the previous ATH was cleared, the stock entered price discovery territory.
With no major historical resistance above ₹1,275, the stock started making a series of Higher Highs and Higher Lows, leading to a sharp momentum move.
📌 Step 4 – Pullback & Continuation
After the strong rally, the stock witnessed a sharp pullback from the recent highs.
But instead of completely losing the breakout structure, buyers stepped in again and pushed the stock back towards the highs.
This is the kind of price action I like to watch:
Breakout → Momentum → Pullback → Buyers step in → Continuation
📌 What I am watching now
The ₹1,275 breakout zone remains an important structural level.
As long as the stock continues to hold well above the major breakout zone and maintains the Higher High–Higher Low structure, the broader momentum setup remains interesting.
The next important observation would be how price behaves around the recent ATH zone.
A decisive breakout above the recent high could potentially lead to another phase of price discovery.
⚠️ At the same time, after such a sharp move, chasing the stock at elevated levels comes with higher risk. I would rather watch for healthy consolidation or a controlled pullback than blindly chase a large green candle.
This is exactly why I like studying breakout charts — the breakout itself is only one part of the setup. What happens AFTER the breakout is equally important.
What do you think about CHENNPETRO at these levels? 👇
Breakout → Retest/Consolidation → Continuation?
#CHENNPETRO #ChennaiPetroleum #Breakout #AllTimeHigh #MomentumTrading #PriceAction #SwingTrading #TechnicalAnalysis #NSE #IndianStocks
Educational purpose only. Not a buy/sell recommendation.

Related publications
Disclaimer
The information and publications are not meant to be, and do not constitute, financial, investment, trading, or other types of advice or recommendations supplied or endorsed by TradingView. Read more in the Terms of Use.
Related publications
Disclaimer
The information and publications are not meant to be, and do not constitute, financial, investment, trading, or other types of advice or recommendations supplied or endorsed by TradingView. Read more in the Terms of Use.