
## **Coal India Ltd – Daily Time Frame | Bullish Harmonic Reversal Setup**
📊 **Stock:** Coal India Ltd (NSE)
💰 **CMP:** ₹403.45
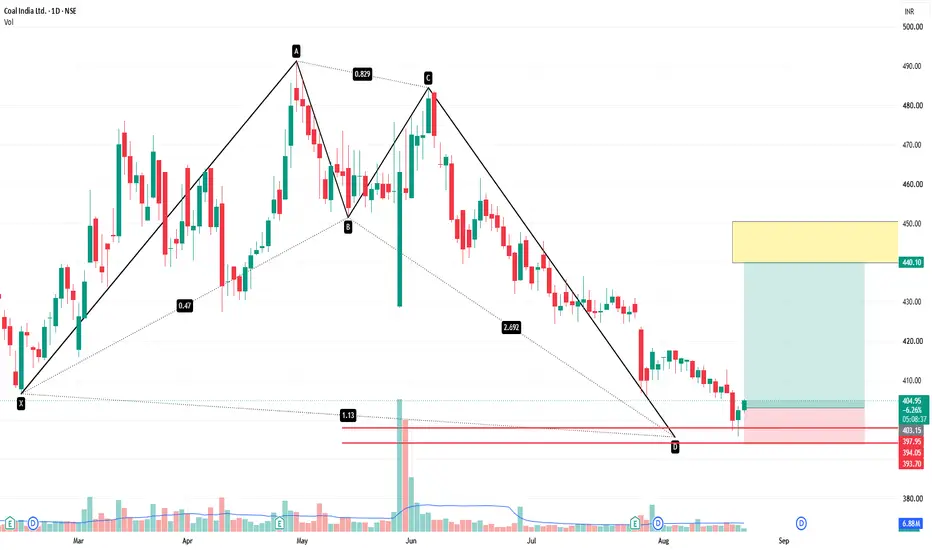
Coal India is currently trading near a **potential Bullish Harmonic Reversal Zone around ₹394–₹403**. The XABCD structure has completed near the **D point**, and price is showing an initial reaction from this support area.
### **Technical Outlook**
* 🟢 **Bullish Harmonic setup** completed near the D point.
* 🟢 Major reversal/support zone: **₹393.70–₹403.30**.
* 🟢 Price is currently holding above the D-point support area.
* 📈 A sustained move above **₹410–₹420** can strengthen the bullish reversal confirmation.
* ⚠️ The broader recent trend has been bearish, so confirmation is important before taking a long position.
### **Potential Trading Plan**
* **Entry Zone:** ₹400–₹403
* **Stop Loss:** Below ₹393.70
* **Target 1:** ₹420
* **Target 2:** ₹430
* **Target 3:** ₹440–₹450
### **Key Levels**
**Bullish Reversal Zone:** ₹393.70–₹403.30
**Immediate Resistance:** ₹420
**Target Zone:** ₹440–₹450
**Major Invalidation:** Below ₹393.70
### **Trade Confirmation**
For a safer entry, wait for a **bullish reversal candle and follow-through above ₹410–₹420**. Increasing volume during the upside move would provide additional confirmation.
If **₹393.70 breaks decisively**, the bullish harmonic setup becomes invalid and the stock may continue its downside movement.
> **Conclusion:**
> Coal India is positioned near a **potential bullish harmonic reversal zone** after a prolonged decline. The **₹394–₹403 area** is the key support/reversal region. If this zone holds and price confirms a bullish reversal, the stock can potentially move towards **₹420 → ₹430 → ₹440–₹450**. Strict risk management is essential because the setup is invalid below the marked support.
**Disclaimer:** This analysis is for educational purposes only and is based on the chart structure shown. It is not investment advice. Always wait for confirmation and use appropriate position sizing and risk management.
📊 **Stock:** Coal India Ltd (NSE)
💰 **CMP:** ₹403.45
Coal India is currently trading near a **potential Bullish Harmonic Reversal Zone around ₹394–₹403**. The XABCD structure has completed near the **D point**, and price is showing an initial reaction from this support area.
### **Technical Outlook**
* 🟢 **Bullish Harmonic setup** completed near the D point.
* 🟢 Major reversal/support zone: **₹393.70–₹403.30**.
* 🟢 Price is currently holding above the D-point support area.
* 📈 A sustained move above **₹410–₹420** can strengthen the bullish reversal confirmation.
* ⚠️ The broader recent trend has been bearish, so confirmation is important before taking a long position.
### **Potential Trading Plan**
* **Entry Zone:** ₹400–₹403
* **Stop Loss:** Below ₹393.70
* **Target 1:** ₹420
* **Target 2:** ₹430
* **Target 3:** ₹440–₹450
### **Key Levels**
**Bullish Reversal Zone:** ₹393.70–₹403.30
**Immediate Resistance:** ₹420
**Target Zone:** ₹440–₹450
**Major Invalidation:** Below ₹393.70
### **Trade Confirmation**
For a safer entry, wait for a **bullish reversal candle and follow-through above ₹410–₹420**. Increasing volume during the upside move would provide additional confirmation.
If **₹393.70 breaks decisively**, the bullish harmonic setup becomes invalid and the stock may continue its downside movement.
> **Conclusion:**
> Coal India is positioned near a **potential bullish harmonic reversal zone** after a prolonged decline. The **₹394–₹403 area** is the key support/reversal region. If this zone holds and price confirms a bullish reversal, the stock can potentially move towards **₹420 → ₹430 → ₹440–₹450**. Strict risk management is essential because the setup is invalid below the marked support.
**Disclaimer:** This analysis is for educational purposes only and is based on the chart structure shown. It is not investment advice. Always wait for confirmation and use appropriate position sizing and risk management.

Disclaimer
The information and publications are not meant to be, and do not constitute, financial, investment, trading, or other types of advice or recommendations supplied or endorsed by TradingView. Read more in the Terms of Use.
Disclaimer
The information and publications are not meant to be, and do not constitute, financial, investment, trading, or other types of advice or recommendations supplied or endorsed by TradingView. Read more in the Terms of Use.