
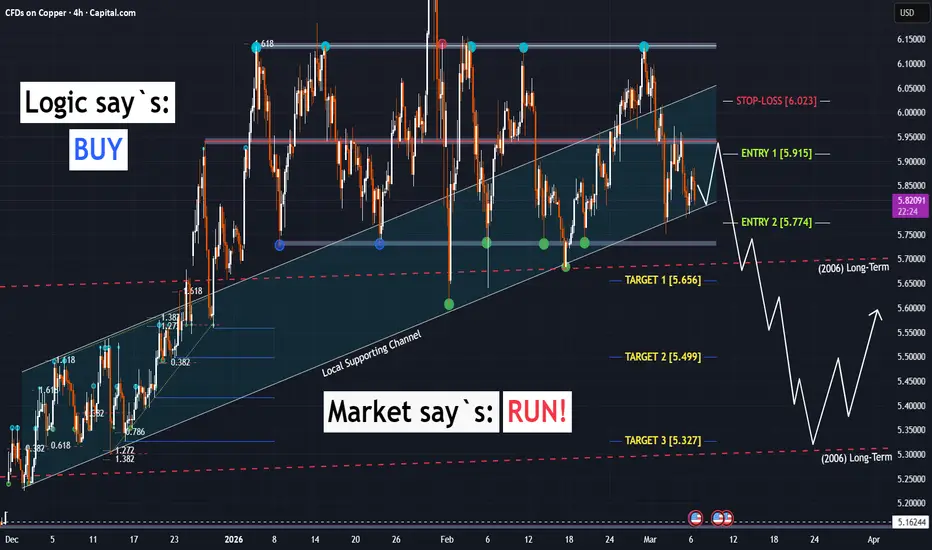
Logistics in ruins and supply chains in chaos, yet Copper is stuck in a sideways range while inventories hit record peaks. Is Copper fundamentally broken, or are we on the verge of the biggest deception of the year?
# - - - - -
Global picture:
1. Copper remains within a global uptrend.
2. Since late December, the price has been oscillating within a horizontal range (consolidation phase).
3. The price is systematically testing both the upper and lower boundaries of the channel, without a definitive breakout in either direction.
4. Typically, such formations serve as accumulation zones, suggesting a potential continuation of the major trend.
5. Price action continues to hold within the Local Supporting Channel.
# - - - - -
BUT (Local Picture):
1. Technically, the price is currently rotating from the upper boundary at 6.135 of the consolidation range toward the lower boundary at 5.73.
2. Copper is trading near multi-year highs, which makes the production costs for end-users relatively high.
3. Commodity exchanges have seen record-breaking stockpiles of the metal over recent months.
4. Despite logistical bottlenecks caused by global tensions, copper has failed to go higher in recent days (unlike crude oil).
5. This price action signals a localized cooling in demand by end-users.
6. Given the drop in demand for metalls in total (including Silver), extraction and production rates are expected to see a local decline.
7. These factors are likely to exert downward pressure on the price over the next 1–2 months.
# - - - - -
Summary:
The probability of a local correction within the range currently outweighs the probability of an immediate trend continuation.
# - - - - -
Trading Plan: 1–2 Month Horizon:
# - - - - -
Scenario 1: Accumulation Zone Mid-line Retest
(Condition: A fakeout/stop-run above 5.94, representing the median price level of the accumulation zone).
✅ Entry Point 1: 5.915 (confirmed after a price reversal)
🛑 Stop-Loss: 6.023
🤑 Target 1: 5.656
🤑 Target 2: 5.499
🤑 Target 3: 5.327
# - - - - -
Scenario 2: Direct Bearish Expansion
(Condition: Price rejection from the [5.69, 5.73] zone followed by a successful retest of the local supporting channel's bottom line).
✅ Entry Point 2: 5.774 (following a retest of the bottom line)
🛑 Stop-Loss: 6.023
🤑 Target 1: 5.656
🤑 Target 2: 5.499
🤑 Target 3: 5.327
# - - - - -
Both short scenarios are invalidated if price strongly closes above 5.975
# - - - - -
Good Luck! ☺️
# - - - - -
DISCLAIMER: Not financial advice. Everyone must make trading decisions at their own risk, guided only by their own criteria and strategy for opening or not opening a trade
# - - - - -
P.S. Are you trapped yet? Or is it me getting trapped?
# - - - - -
Global picture:
1. Copper remains within a global uptrend.
2. Since late December, the price has been oscillating within a horizontal range (consolidation phase).
3. The price is systematically testing both the upper and lower boundaries of the channel, without a definitive breakout in either direction.
4. Typically, such formations serve as accumulation zones, suggesting a potential continuation of the major trend.
5. Price action continues to hold within the Local Supporting Channel.
# - - - - -
BUT (Local Picture):
1. Technically, the price is currently rotating from the upper boundary at 6.135 of the consolidation range toward the lower boundary at 5.73.
2. Copper is trading near multi-year highs, which makes the production costs for end-users relatively high.
3. Commodity exchanges have seen record-breaking stockpiles of the metal over recent months.
4. Despite logistical bottlenecks caused by global tensions, copper has failed to go higher in recent days (unlike crude oil).
5. This price action signals a localized cooling in demand by end-users.
6. Given the drop in demand for metalls in total (including Silver), extraction and production rates are expected to see a local decline.
7. These factors are likely to exert downward pressure on the price over the next 1–2 months.
# - - - - -
Summary:
The probability of a local correction within the range currently outweighs the probability of an immediate trend continuation.
# - - - - -
Trading Plan: 1–2 Month Horizon:
# - - - - -
Scenario 1: Accumulation Zone Mid-line Retest
(Condition: A fakeout/stop-run above 5.94, representing the median price level of the accumulation zone).
✅ Entry Point 1: 5.915 (confirmed after a price reversal)
🛑 Stop-Loss: 6.023
🤑 Target 1: 5.656
🤑 Target 2: 5.499
🤑 Target 3: 5.327
# - - - - -
Scenario 2: Direct Bearish Expansion
(Condition: Price rejection from the [5.69, 5.73] zone followed by a successful retest of the local supporting channel's bottom line).
✅ Entry Point 2: 5.774 (following a retest of the bottom line)
🛑 Stop-Loss: 6.023
🤑 Target 1: 5.656
🤑 Target 2: 5.499
🤑 Target 3: 5.327
# - - - - -
Both short scenarios are invalidated if price strongly closes above 5.975
# - - - - -
Good Luck! ☺️
# - - - - -
DISCLAIMER: Not financial advice. Everyone must make trading decisions at their own risk, guided only by their own criteria and strategy for opening or not opening a trade
# - - - - -
P.S. Are you trapped yet? Or is it me getting trapped?
Trade active
Price reached 1st target 5.656 and afterwards retested the ascending channle bottom line, confirming the planned 1st entry at Entry Point 1 (5.774) for 50% of positionNote
Price reached 5.94 resistance level. If the level holds and rejects the price, the second entry for the remaining 50% will we doneNote
Opened 100% of the positionNote
Support is once again found on the Upper Bound of the Long Term Support Channel. Price has to stay below 5.98 to remain in bearish movement. Breaking above for a liquidity hunt might push the price towards 6.13 resistanceTrade closed: target reached
Price reached Final Target 3. Closed 100% of the Position by TP
Visit my Risk Enforcement App → mywarner.app/
Follow me on Telegram → t.me/totsamiykaa
Watch me on YT → youtube.com/@totsamiykaa
See me on Threads → threads.com/@totsamiykaa
Follow me on Telegram → t.me/totsamiykaa
Watch me on YT → youtube.com/@totsamiykaa
See me on Threads → threads.com/@totsamiykaa
Related publications
Disclaimer
The information and publications are not meant to be, and do not constitute, financial, investment, trading, or other types of advice or recommendations supplied or endorsed by TradingView. Read more in the Terms of Use.
Visit my Risk Enforcement App → mywarner.app/
Follow me on Telegram → t.me/totsamiykaa
Watch me on YT → youtube.com/@totsamiykaa
See me on Threads → threads.com/@totsamiykaa
Follow me on Telegram → t.me/totsamiykaa
Watch me on YT → youtube.com/@totsamiykaa
See me on Threads → threads.com/@totsamiykaa
Related publications
Disclaimer
The information and publications are not meant to be, and do not constitute, financial, investment, trading, or other types of advice or recommendations supplied or endorsed by TradingView. Read more in the Terms of Use.