
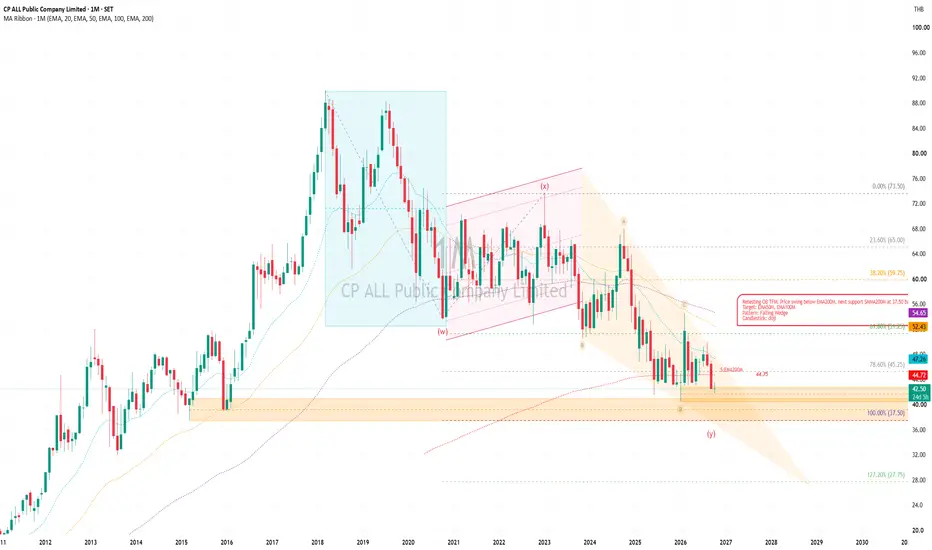
Wave Pattern Analysis: WXY
- W - Extended Flat
- X - Bear Flag
- Y - Falling Wedge ** Normally the last correction
TFM candlestick: Doji
Long Entry @ Falling Wedge Wave Y breakout
Target Upside: Immediate 20% - 30% EMA50 - 100 - month
Support Zone (Monthly Order Block & Dynamic Support): Price is holding the upper boundary of the January 2026 Order Block (OB) around 42.00–42.50 THB. Concurrently, the 200-month EMA is acting as a strong macro dynamic floor, absorbing selling pressure/ liquidity.
Key Dynamic Resistance: The immediate hurdle on any recovery attempt remains the 20-month EMA (around the 44.75–45.75 THB region)
Upside Targets: A decisive close above the 20-month EMA opens the pathway toward higher-frame dynamic targets at the 50-month and 100-month EMAs + 20% - 30% upside
If price loses the upper edge of the weekly OB and breaks below the 200-month EMA, the next major downside structural support sits around the lower yellow liquidity box near 37.50 THB(SMMA 200 Month)
***Look out for possible as a false breakdown - Liquidity trading zone***
- W - Extended Flat
- X - Bear Flag
- Y - Falling Wedge ** Normally the last correction
TFM candlestick: Doji
Long Entry @ Falling Wedge Wave Y breakout
Target Upside: Immediate 20% - 30% EMA50 - 100 - month
Support Zone (Monthly Order Block & Dynamic Support): Price is holding the upper boundary of the January 2026 Order Block (OB) around 42.00–42.50 THB. Concurrently, the 200-month EMA is acting as a strong macro dynamic floor, absorbing selling pressure/ liquidity.
Key Dynamic Resistance: The immediate hurdle on any recovery attempt remains the 20-month EMA (around the 44.75–45.75 THB region)
Upside Targets: A decisive close above the 20-month EMA opens the pathway toward higher-frame dynamic targets at the 50-month and 100-month EMAs + 20% - 30% upside
If price loses the upper edge of the weekly OB and breaks below the 200-month EMA, the next major downside structural support sits around the lower yellow liquidity box near 37.50 THB(SMMA 200 Month)
***Look out for possible as a false breakdown - Liquidity trading zone***

Disclaimer
The information and publications are not meant to be, and do not constitute, financial, investment, trading, or other types of advice or recommendations supplied or endorsed by TradingView. Read more in the Terms of Use.
Disclaimer
The information and publications are not meant to be, and do not constitute, financial, investment, trading, or other types of advice or recommendations supplied or endorsed by TradingView. Read more in the Terms of Use.