
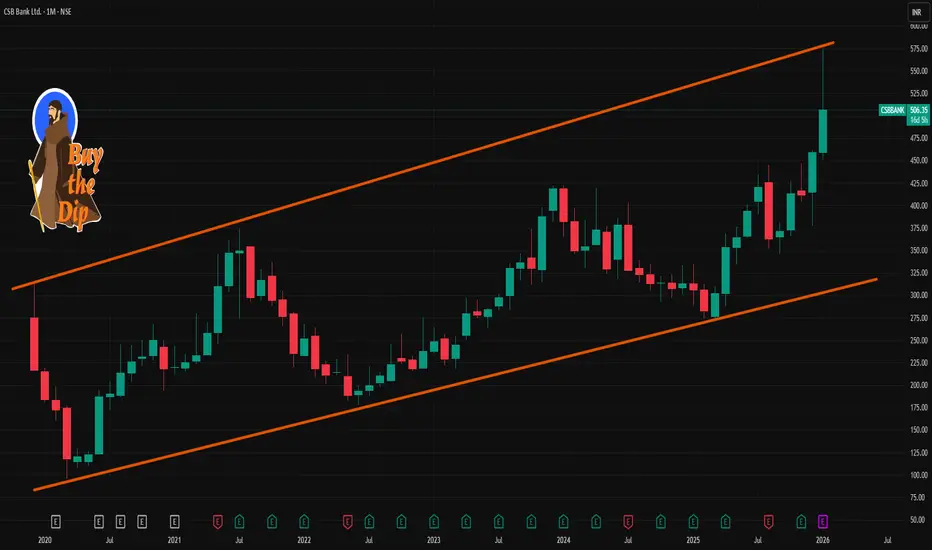
📌 Last Closing / Recent Price (delayed data)
• Around ₹505–₹520 range recently, showing strong short‑term price action.
🔍 Short‑Term (1‑Month) Key Levels
📈 Resistance Levels
These are levels where price may face selling pressure in short‑term moves:
R1: ~₹514–₹518 – first resistance zone.
R2: ~₹530–₹532 – next broader resistance if rally continues.
R3: ~₹543–₹557 – higher resistance area in 1‑month horizon.
Tactical View: Break above ~₹532–₹543 could signal continuation to higher short‑term highs.
📉 Support Levels
These are areas where dips may find buyers near:
S1: ~₹495–₹496 – first nearby support.
S2: ~₹484–₹485 – deeper support if dip extends.
S3: ~₹456–₹480 – broader support cluster if stronger correction.
Tactical View: A break below ~₹484–₹480 risks deeper consolidation.
🔄 Pivot Zone
Used by traders as dynamic center for short‑term bias:
Pivot: ~₹501–₹502 area — key reference for session trend.
Above pivot = bullish bias; below pivot = cautious/neutral in short horizon.
📊 Moving Averages (short‑term context)
Helpful for trend confirmation:
20‑day EMA/SMA: ~₹463–₹446 area — below current price => bullish trend.
50‑day SMA: ~₹433 — deeper trend support.
Current price is above these averages → trend remains bullish on 1‑month basis.
📈 Short‑Term Trade Bias (1‑month)
Bullish Scenario:
If price holds above pivot ~₹501–₹505 and support ~₹495, upside may test ₹518 → ₹532 → ₹543+.
Bearish Scenario (correction):
If price falls below ₹495 → ₹484, watch deeper support ₹474–₹456.
• Around ₹505–₹520 range recently, showing strong short‑term price action.
🔍 Short‑Term (1‑Month) Key Levels
📈 Resistance Levels
These are levels where price may face selling pressure in short‑term moves:
R1: ~₹514–₹518 – first resistance zone.
R2: ~₹530–₹532 – next broader resistance if rally continues.
R3: ~₹543–₹557 – higher resistance area in 1‑month horizon.
Tactical View: Break above ~₹532–₹543 could signal continuation to higher short‑term highs.
📉 Support Levels
These are areas where dips may find buyers near:
S1: ~₹495–₹496 – first nearby support.
S2: ~₹484–₹485 – deeper support if dip extends.
S3: ~₹456–₹480 – broader support cluster if stronger correction.
Tactical View: A break below ~₹484–₹480 risks deeper consolidation.
🔄 Pivot Zone
Used by traders as dynamic center for short‑term bias:
Pivot: ~₹501–₹502 area — key reference for session trend.
Above pivot = bullish bias; below pivot = cautious/neutral in short horizon.
📊 Moving Averages (short‑term context)
Helpful for trend confirmation:
20‑day EMA/SMA: ~₹463–₹446 area — below current price => bullish trend.
50‑day SMA: ~₹433 — deeper trend support.
Current price is above these averages → trend remains bullish on 1‑month basis.
📈 Short‑Term Trade Bias (1‑month)
Bullish Scenario:
If price holds above pivot ~₹501–₹505 and support ~₹495, upside may test ₹518 → ₹532 → ₹543+.
Bearish Scenario (correction):
If price falls below ₹495 → ₹484, watch deeper support ₹474–₹456.

Contact Knowledgehub for a detailed consultation: Dm on WhatsApp: [wa.link/a2o0kz]-
Phone No: [+91 93102 26243]-
Email: [tradingviewknowledgehub@gmail.com]---
-- Let’s achieve success together!
Phone No: [+91 93102 26243]-
Email: [tradingviewknowledgehub@gmail.com]---
-- Let’s achieve success together!
Related publications
Disclaimer
The information and publications are not meant to be, and do not constitute, financial, investment, trading, or other types of advice or recommendations supplied or endorsed by TradingView. Read more in the Terms of Use.
Contact Knowledgehub for a detailed consultation: Dm on WhatsApp: [wa.link/a2o0kz]-
Phone No: [+91 93102 26243]-
Email: [tradingviewknowledgehub@gmail.com]---
-- Let’s achieve success together!
Phone No: [+91 93102 26243]-
Email: [tradingviewknowledgehub@gmail.com]---
-- Let’s achieve success together!
Related publications
Disclaimer
The information and publications are not meant to be, and do not constitute, financial, investment, trading, or other types of advice or recommendations supplied or endorsed by TradingView. Read more in the Terms of Use.