
Timeframe: 1D
CMP: ₹4,800
Structure: Elliott Wave + Descending Corrective Channel
Key Zone: ₹4,809 – ₹4,800
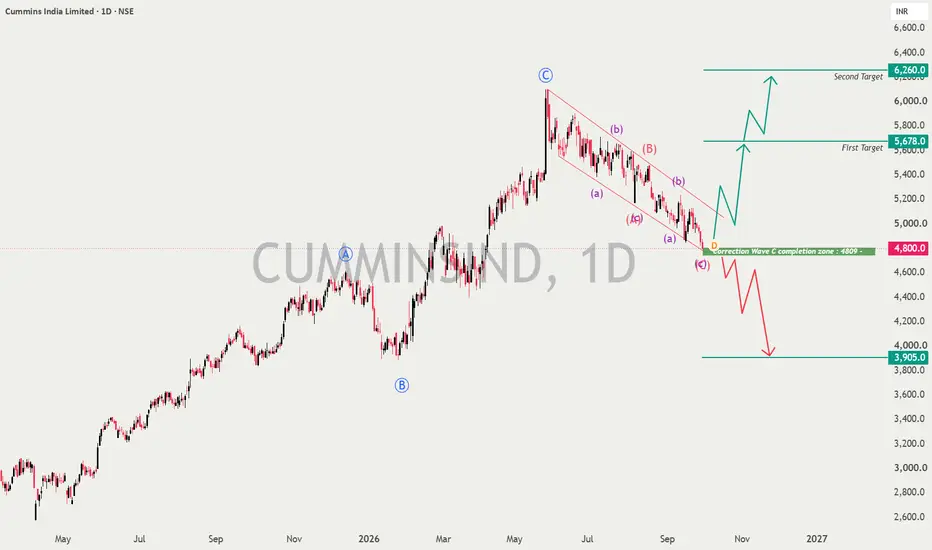
Cummins India is currently trading at a very important technical decision point. The stock has undergone a prolonged correction from the June high near ₹6,050 and is now approaching the lower end of its corrective structure.
The chart suggests that the ongoing decline may represent a larger Wave C correction, with price now entering the marked Wave C completion zone around ₹4,809.
🔹 1. Elliott Wave Structure
The larger move from the 2025 low appears to have developed into an A-B-C corrective structure.
• Wave A: Initial corrective decline
• Wave B: Recovery toward the ₹6,000+ region
• Wave C: Current declining structure
Within Wave C, the price action is developing as a smaller-degree corrective sequence, with successive lower highs and lower lows.
This gives the current ₹4,800–₹4,809 area significant technical importance.
🔹 2. Descending Channel
The correction has been contained within a clearly visible descending channel.
Price is currently approaching the lower portion of this channel while simultaneously reaching the projected Wave C completion area.
When multiple technical structures converge at the same price zone, that area becomes important for monitoring a potential reaction.
However, the Elliott Wave interpretation remains a hypothesis until price confirms the reversal.
🔹 3. Bullish Scenario – Reversal from ₹4,800 Zone
The primary bullish confirmation would be a sustained hold around ₹4,800–₹4,809, followed by a reversal and breakout of the descending corrective structure.
If price starts forming higher highs and higher lows after defending this zone, the following levels become important:
First Target: ₹5,678
Second Target: ₹6,260
The ₹5,678 level represents the first major upside objective marked on the chart, while ₹6,260 represents the extended target if the larger bullish structure resumes.
The move toward these targets should ideally be accompanied by:
• Breakout from the descending channel
• Sustained closes above important swing highs
• Expansion in momentum
• Formation of higher highs and higher lows
🔹 4. Bearish Scenario – Breakdown Below ₹4,800
The bullish Wave C completion hypothesis would become weaker if price decisively breaks below the ₹4,800–₹4,809 region and sustains below the corrective structure.
In that situation, the next major downside level visible on the chart is:
₹3,905
Therefore, ₹4,800 is not simply a support level—it is the key decision zone between a potential corrective completion and continuation of the decline.
🔹 5. Important Levels
🟢 Critical Support / Wave C Zone: ₹4,800–₹4,809
🔴 Breakdown Reference: Below ₹4,800
🎯 First Upside Target: ₹5,678
🎯 Second Upside Target: ₹6,260
⚠️ Major Downside Level: ₹3,905
🔹 6. What to Watch Next
Rather than assuming that ₹4,800 will automatically hold, traders can monitor price behaviour around this zone.
Bullish confirmation:
₹4,800 zone holds → reversal → higher low → descending-channel breakout → upside continuation.
Bearish confirmation:
₹4,800 breaks decisively → failed support → continuation of lower-high/lower-low structure → downside toward ₹3,905.
📌 Key Takeaway
Cummins India is currently sitting at a technically significant junction.
The combination of the descending corrective channel and the projected Wave C completion zone near ₹4,809 makes ₹4,800–₹4,809 the most important area on this chart.
Above this zone: watch for reversal and channel breakout, with ₹5,678 and ₹6,260 as the marked upside objectives.
Below this zone: the corrective structure can extend further, with ₹3,905 as the major downside reference shown on the chart.
This is a technical setup, not a prediction. Price confirmation remains essential.
Disclaimer: This post is for educational and informational purposes only and should not be considered investment advice. I am not a SEBI registered analyst. Please conduct your own research and follow appropriate risk management before taking any trading or investment decision.
CMP: ₹4,800
Structure: Elliott Wave + Descending Corrective Channel
Key Zone: ₹4,809 – ₹4,800
Cummins India is currently trading at a very important technical decision point. The stock has undergone a prolonged correction from the June high near ₹6,050 and is now approaching the lower end of its corrective structure.
The chart suggests that the ongoing decline may represent a larger Wave C correction, with price now entering the marked Wave C completion zone around ₹4,809.
🔹 1. Elliott Wave Structure
The larger move from the 2025 low appears to have developed into an A-B-C corrective structure.
• Wave A: Initial corrective decline
• Wave B: Recovery toward the ₹6,000+ region
• Wave C: Current declining structure
Within Wave C, the price action is developing as a smaller-degree corrective sequence, with successive lower highs and lower lows.
This gives the current ₹4,800–₹4,809 area significant technical importance.
🔹 2. Descending Channel
The correction has been contained within a clearly visible descending channel.
Price is currently approaching the lower portion of this channel while simultaneously reaching the projected Wave C completion area.
When multiple technical structures converge at the same price zone, that area becomes important for monitoring a potential reaction.
However, the Elliott Wave interpretation remains a hypothesis until price confirms the reversal.
🔹 3. Bullish Scenario – Reversal from ₹4,800 Zone
The primary bullish confirmation would be a sustained hold around ₹4,800–₹4,809, followed by a reversal and breakout of the descending corrective structure.
If price starts forming higher highs and higher lows after defending this zone, the following levels become important:
First Target: ₹5,678
Second Target: ₹6,260
The ₹5,678 level represents the first major upside objective marked on the chart, while ₹6,260 represents the extended target if the larger bullish structure resumes.
The move toward these targets should ideally be accompanied by:
• Breakout from the descending channel
• Sustained closes above important swing highs
• Expansion in momentum
• Formation of higher highs and higher lows
🔹 4. Bearish Scenario – Breakdown Below ₹4,800
The bullish Wave C completion hypothesis would become weaker if price decisively breaks below the ₹4,800–₹4,809 region and sustains below the corrective structure.
In that situation, the next major downside level visible on the chart is:
₹3,905
Therefore, ₹4,800 is not simply a support level—it is the key decision zone between a potential corrective completion and continuation of the decline.
🔹 5. Important Levels
🟢 Critical Support / Wave C Zone: ₹4,800–₹4,809
🔴 Breakdown Reference: Below ₹4,800
🎯 First Upside Target: ₹5,678
🎯 Second Upside Target: ₹6,260
⚠️ Major Downside Level: ₹3,905
🔹 6. What to Watch Next
Rather than assuming that ₹4,800 will automatically hold, traders can monitor price behaviour around this zone.
Bullish confirmation:
₹4,800 zone holds → reversal → higher low → descending-channel breakout → upside continuation.
Bearish confirmation:
₹4,800 breaks decisively → failed support → continuation of lower-high/lower-low structure → downside toward ₹3,905.
📌 Key Takeaway
Cummins India is currently sitting at a technically significant junction.
The combination of the descending corrective channel and the projected Wave C completion zone near ₹4,809 makes ₹4,800–₹4,809 the most important area on this chart.
Above this zone: watch for reversal and channel breakout, with ₹5,678 and ₹6,260 as the marked upside objectives.
Below this zone: the corrective structure can extend further, with ₹3,905 as the major downside reference shown on the chart.
This is a technical setup, not a prediction. Price confirmation remains essential.
Disclaimer: This post is for educational and informational purposes only and should not be considered investment advice. I am not a SEBI registered analyst. Please conduct your own research and follow appropriate risk management before taking any trading or investment decision.

Disclaimer
The information and publications are not meant to be, and do not constitute, financial, investment, trading, or other types of advice or recommendations supplied or endorsed by TradingView. Read more in the Terms of Use.
Disclaimer
The information and publications are not meant to be, and do not constitute, financial, investment, trading, or other types of advice or recommendations supplied or endorsed by TradingView. Read more in the Terms of Use.