
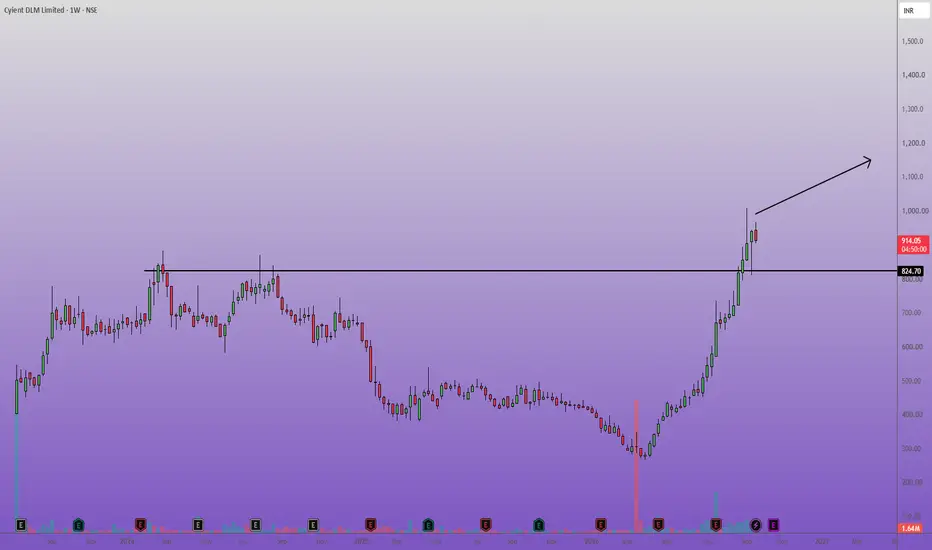
This idea outlines a long setup for Cyient DLM Limited based on the weekly timeframe.
Analysis & Rationale:
The chart displays a strong multi-month resistance level at 824.70, which the price previously rejected in early 2024 and mid-2024.
Recently, the stock has decisively broken out above this critical horizontal resistance on the weekly chart.
It is currently sustaining its levels above this line, turning the previous resistance into a strong support base.
The consistent build-up leading to this breakout shows strong bullish momentum, providing at least two technical reasons for this setup: a major structural breakout and price holding at a key flipped support level.
Trade Setup:
Bias: Long
Entry Point: The current market price around 918 is a valid entry, or you can look to accumulate on minor pullbacks towards the 830–860 zone near the support line.
Target: Based on the depth of the prior consolidation structure, positional targets can be projected higher towards the 1150–1200 levels.
Stoploss: A daily or weekly close below the breakout level and recent swing lows (around 760–780) would invalidate the setup, serving as a strict stoploss to manage downside risk.
Trade Duration: Because this analysis is derived from a weekly chart, this is a positional swing trade that could take several weeks to a few months to play out.
Analysis & Rationale:
The chart displays a strong multi-month resistance level at 824.70, which the price previously rejected in early 2024 and mid-2024.
Recently, the stock has decisively broken out above this critical horizontal resistance on the weekly chart.
It is currently sustaining its levels above this line, turning the previous resistance into a strong support base.
The consistent build-up leading to this breakout shows strong bullish momentum, providing at least two technical reasons for this setup: a major structural breakout and price holding at a key flipped support level.
Trade Setup:
Bias: Long
Entry Point: The current market price around 918 is a valid entry, or you can look to accumulate on minor pullbacks towards the 830–860 zone near the support line.
Target: Based on the depth of the prior consolidation structure, positional targets can be projected higher towards the 1150–1200 levels.
Stoploss: A daily or weekly close below the breakout level and recent swing lows (around 760–780) would invalidate the setup, serving as a strict stoploss to manage downside risk.
Trade Duration: Because this analysis is derived from a weekly chart, this is a positional swing trade that could take several weeks to a few months to play out.
Trade closed: stop reached
Stop-Loss Hit...
Disclaimer
The information and publications are not meant to be, and do not constitute, financial, investment, trading, or other types of advice or recommendations supplied or endorsed by TradingView. Read more in the Terms of Use.
Disclaimer
The information and publications are not meant to be, and do not constitute, financial, investment, trading, or other types of advice or recommendations supplied or endorsed by TradingView. Read more in the Terms of Use.