
DATAMATICS – Symmetrical Triangle Breakout Watch on Weekly Chart
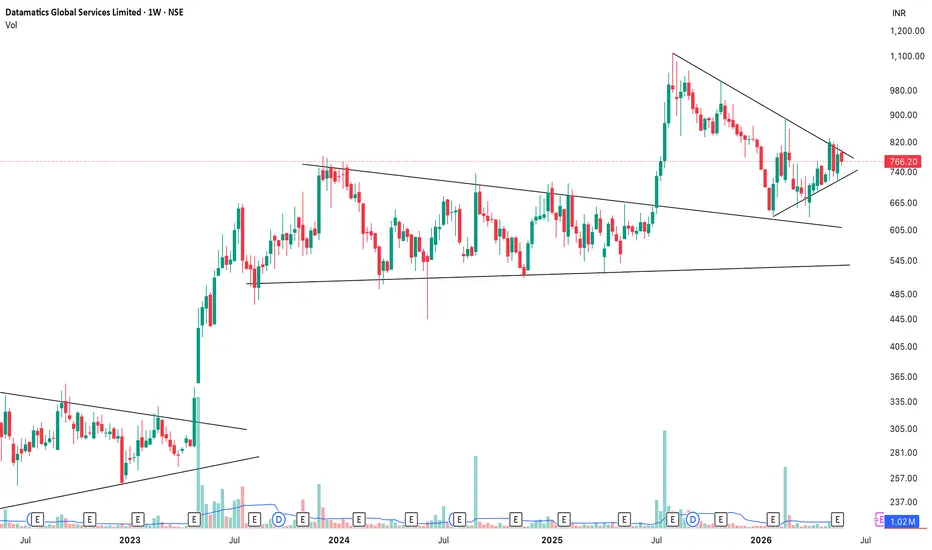
📈 Stock: DATAMATICS (Datamatics Global Services Ltd.)
Observation:
The stock is currently consolidating within a symmetrical triangle pattern on the weekly timeframe after a strong impulsive move. Price action is tightening near the apex, indicating a potential breakout setup in the coming weeks.
Technical Factors:
✔ Symmetrical Triangle Formation
✔ Price Consolidation Near Resistance
✔ Strong Historical Momentum
✔ Volume Monitoring For Confirmation
Key Levels:
• Resistance Zone: Triangle upper trendline
• Support Zone: Triangle lower trendline
• Breakout Confirmation: Sustained move above resistance with volume
• Breakdown Risk: Close below support trendline
Expectation:
Keeping DATAMATICS on watch as price approaches a decisive zone. A breakout with volume confirmation may lead to momentum continuation, while rejection could result in further consolidation.
What are your views on this setup?
What are your views on this setup?
📌 Follow @thebreakout.lab for more educational breakout setups, technical analysis, and high-quality chart studies.
If you found this analysis useful, don’t forget to like, boost, and follow for more market insights.
⚠ Disclaimer:
Stock analysis posted here is for educational purposes only. We encourage you to do your own analysis before taking any trade, this is not a recommendation to buy or sell.
We are not SEBI Registered Advisors. We shall not be responsible for your profit or loss. Please confirm with your investment advisor.
Observation:
The stock is currently consolidating within a symmetrical triangle pattern on the weekly timeframe after a strong impulsive move. Price action is tightening near the apex, indicating a potential breakout setup in the coming weeks.
Technical Factors:
✔ Symmetrical Triangle Formation
✔ Price Consolidation Near Resistance
✔ Strong Historical Momentum
✔ Volume Monitoring For Confirmation
Key Levels:
• Resistance Zone: Triangle upper trendline
• Support Zone: Triangle lower trendline
• Breakout Confirmation: Sustained move above resistance with volume
• Breakdown Risk: Close below support trendline
Expectation:
Keeping DATAMATICS on watch as price approaches a decisive zone. A breakout with volume confirmation may lead to momentum continuation, while rejection could result in further consolidation.
What are your views on this setup?
What are your views on this setup?
📌 Follow @thebreakout.lab for more educational breakout setups, technical analysis, and high-quality chart studies.
If you found this analysis useful, don’t forget to like, boost, and follow for more market insights.
⚠ Disclaimer:
Stock analysis posted here is for educational purposes only. We encourage you to do your own analysis before taking any trade, this is not a recommendation to buy or sell.
We are not SEBI Registered Advisors. We shall not be responsible for your profit or loss. Please confirm with your investment advisor.

Disclaimer
The information and publications are not meant to be, and do not constitute, financial, investment, trading, or other types of advice or recommendations supplied or endorsed by TradingView. Read more in the Terms of Use.
Disclaimer
The information and publications are not meant to be, and do not constitute, financial, investment, trading, or other types of advice or recommendations supplied or endorsed by TradingView. Read more in the Terms of Use.