
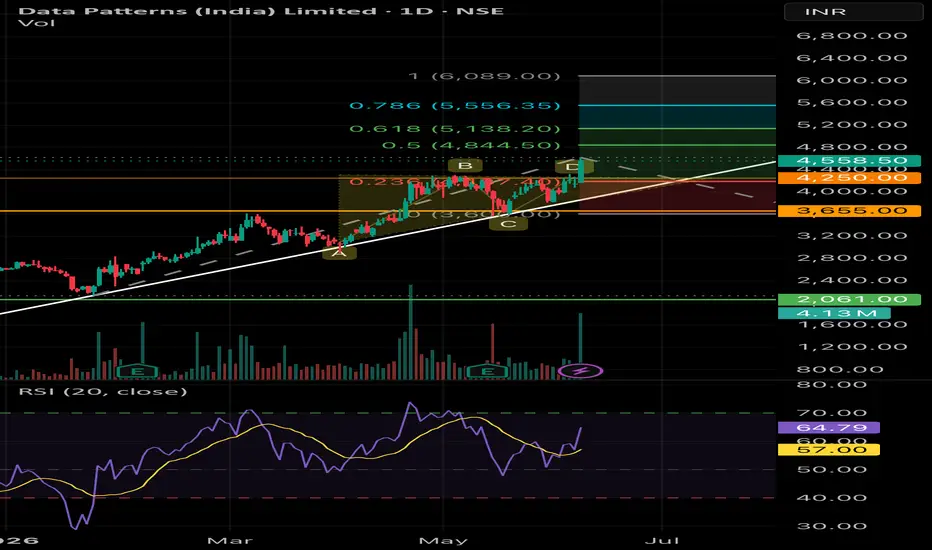
DATA PATTERNS (INDIA) LTD | Trend-Based Fibonacci Projection
The stock continues to maintain its long-term bullish structure, respecting the rising trendline and forming a series of higher highs and higher lows. After a healthy consolidation phase, price is showing signs of resuming the primary uptrend.
Using Trend-Based Fibonacci projections, the following levels will be crucial to watch:
Upside Targets
🔹 ₹4,845 – 50% Fib Projection
🔹 ₹5,138 – 61.8% Fib Projection
🔹 ₹5,556 – 78.6% Fib Projection
🔹 ₹6,089 – 100% Fib Projection
Support Levels
🔸 ₹4,150–₹4,200 – Immediate support zone
🔸 ₹4,050–₹4,100 – Trendline support
🔸 ₹3,655 – Major structural support
RSI has recovered strongly and is trading above its signal line, indicating improving momentum. As long as the stock sustains above the immediate support zone, the probability of testing higher Fibonacci projection levels remains favourable.
Also, The stock appears to be forming a symmetrical triangle after a strong uptrend, indicating a period of consolidation before the next directional move. Price action is gradually compressing between rising support and falling resistance, suggesting that a significant breakout.
A sustained breakout above the triangle resistance zone around ₹4,350–₹4,400 could confirm the continuation of the primary bullish trend.
A decisive move above recent swing highs could accelerate momentum toward the ₹4,845 and ₹5,138 zones, while maintaining the broader bullish outlook.
Disclaimer: This analysis is shared for educational and informational purposes only and does not constitute investment advice. Markets are subject to risk and uncertainty. Please conduct your own research and use proper risk management before making any trading or investment decisions.
The stock continues to maintain its long-term bullish structure, respecting the rising trendline and forming a series of higher highs and higher lows. After a healthy consolidation phase, price is showing signs of resuming the primary uptrend.
Using Trend-Based Fibonacci projections, the following levels will be crucial to watch:
Upside Targets
🔹 ₹4,845 – 50% Fib Projection
🔹 ₹5,138 – 61.8% Fib Projection
🔹 ₹5,556 – 78.6% Fib Projection
🔹 ₹6,089 – 100% Fib Projection
Support Levels
🔸 ₹4,150–₹4,200 – Immediate support zone
🔸 ₹4,050–₹4,100 – Trendline support
🔸 ₹3,655 – Major structural support
RSI has recovered strongly and is trading above its signal line, indicating improving momentum. As long as the stock sustains above the immediate support zone, the probability of testing higher Fibonacci projection levels remains favourable.
Also, The stock appears to be forming a symmetrical triangle after a strong uptrend, indicating a period of consolidation before the next directional move. Price action is gradually compressing between rising support and falling resistance, suggesting that a significant breakout.
A sustained breakout above the triangle resistance zone around ₹4,350–₹4,400 could confirm the continuation of the primary bullish trend.
A decisive move above recent swing highs could accelerate momentum toward the ₹4,845 and ₹5,138 zones, while maintaining the broader bullish outlook.
Disclaimer: This analysis is shared for educational and informational purposes only and does not constitute investment advice. Markets are subject to risk and uncertainty. Please conduct your own research and use proper risk management before making any trading or investment decisions.

Disclaimer
The information and publications are not meant to be, and do not constitute, financial, investment, trading, or other types of advice or recommendations supplied or endorsed by TradingView. Read more in the Terms of Use.
Disclaimer
The information and publications are not meant to be, and do not constitute, financial, investment, trading, or other types of advice or recommendations supplied or endorsed by TradingView. Read more in the Terms of Use.