
Apoorv Dubey | SEBI Registered Research Analyst
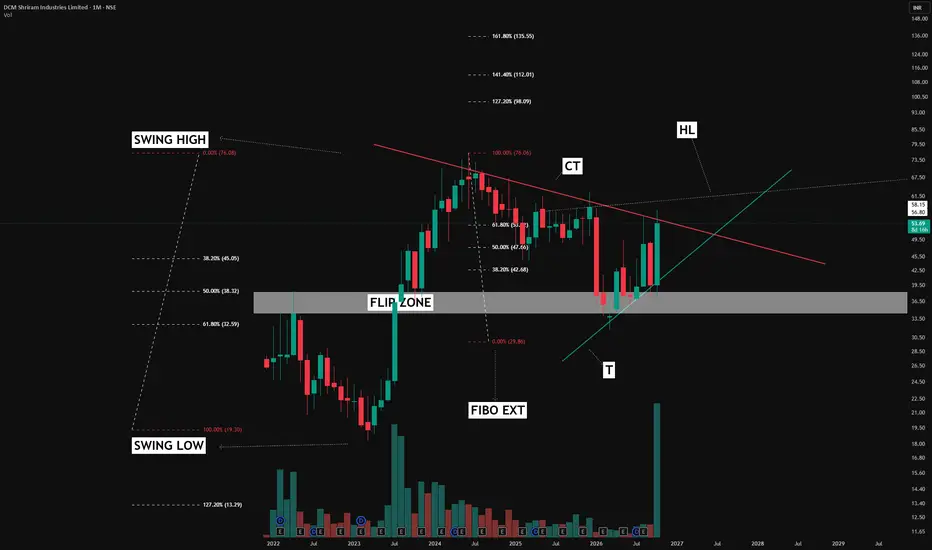
A chart becomes more useful when we understand why each line is drawn. This monthly chart illustrates how different analysis tools can connect to build a price-action framework.
1. Start with the flip zone
The grey band marks an area that previously acted as resistance. After price broke above it, the subsequent revisit found support around this region. This change in role—from resistance to support—is called a flip zone.
2. Mark the swing high and swing low
These reference points anchor the Fibonacci retracement, helping map potential retracement areas within the broader price move.
Here, the flip zone sits within the wider 50%–61.8% retracement region. This overlap is a confluence: different tools highlighting a similar area for closer observation. It adds context, without guaranteeing support will hold.
3. Draw the counter trendline — CT
The descending red line connects reaction highs and maps the downward pressure during the correction. A sustained close above it can help identify a potential change in that structure. A candle moving beyond the line alone does not confirm a lasting breakout.
4. Identify the supporting trendline — T
The rising green line tracks support along the recovery. Together, CT and T help frame how price is moving between descending resistance and rising support.
5. Look for the less obvious line — HL
HL means “hidden line” in my annotations. The dotted line highlights a less obvious resistance reference that could become relevant if price moves above CT. Crossing one resistance does not mean the path ahead is clear.
6. Add Fibonacci extensions
The extension levels provide projected reference areas for studying possible future price reactions. They are analytical projections, rather than assured targets.
The lesson: study how the tools connect. Flip zones provide context, Fibonacci maps reference areas, and trendlines help organise price structure. Price behaviour ultimately determines whether those observations remain valid.
The latest monthly candle is still forming; its final close matters.
For educational purposes only. This post explains charting tools and price-action observations and is not a recommendation to buy, sell or hold any security. Patterns can fail, and projected levels may never be reached.
A chart becomes more useful when we understand why each line is drawn. This monthly chart illustrates how different analysis tools can connect to build a price-action framework.
1. Start with the flip zone
The grey band marks an area that previously acted as resistance. After price broke above it, the subsequent revisit found support around this region. This change in role—from resistance to support—is called a flip zone.
2. Mark the swing high and swing low
These reference points anchor the Fibonacci retracement, helping map potential retracement areas within the broader price move.
Here, the flip zone sits within the wider 50%–61.8% retracement region. This overlap is a confluence: different tools highlighting a similar area for closer observation. It adds context, without guaranteeing support will hold.
3. Draw the counter trendline — CT
The descending red line connects reaction highs and maps the downward pressure during the correction. A sustained close above it can help identify a potential change in that structure. A candle moving beyond the line alone does not confirm a lasting breakout.
4. Identify the supporting trendline — T
The rising green line tracks support along the recovery. Together, CT and T help frame how price is moving between descending resistance and rising support.
5. Look for the less obvious line — HL
HL means “hidden line” in my annotations. The dotted line highlights a less obvious resistance reference that could become relevant if price moves above CT. Crossing one resistance does not mean the path ahead is clear.
6. Add Fibonacci extensions
The extension levels provide projected reference areas for studying possible future price reactions. They are analytical projections, rather than assured targets.
The lesson: study how the tools connect. Flip zones provide context, Fibonacci maps reference areas, and trendlines help organise price structure. Price behaviour ultimately determines whether those observations remain valid.
The latest monthly candle is still forming; its final close matters.
For educational purposes only. This post explains charting tools and price-action observations and is not a recommendation to buy, sell or hold any security. Patterns can fail, and projected levels may never be reached.

📊Swing & positional research with Buy, Sell & Hold recommendations
Contact for NOVEMBER SLOTS
📞WhatsApp ( Pro ): wa.me/919455664601
📢Free Picks on Telegram ( Join ) : t.me/hashtaghammer
Apoorv Dubey|SEBI RA INH000030287
Contact for NOVEMBER SLOTS
📞WhatsApp ( Pro ): wa.me/919455664601
📢Free Picks on Telegram ( Join ) : t.me/hashtaghammer
Apoorv Dubey|SEBI RA INH000030287
Related publications
Disclaimer
The information and publications are not meant to be, and do not constitute, financial, investment, trading, or other types of advice or recommendations supplied or endorsed by TradingView. Read more in the Terms of Use.
📊Swing & positional research with Buy, Sell & Hold recommendations
Contact for NOVEMBER SLOTS
📞WhatsApp ( Pro ): wa.me/919455664601
📢Free Picks on Telegram ( Join ) : t.me/hashtaghammer
Apoorv Dubey|SEBI RA INH000030287
Contact for NOVEMBER SLOTS
📞WhatsApp ( Pro ): wa.me/919455664601
📢Free Picks on Telegram ( Join ) : t.me/hashtaghammer
Apoorv Dubey|SEBI RA INH000030287
Related publications
Disclaimer
The information and publications are not meant to be, and do not constitute, financial, investment, trading, or other types of advice or recommendations supplied or endorsed by TradingView. Read more in the Terms of Use.