
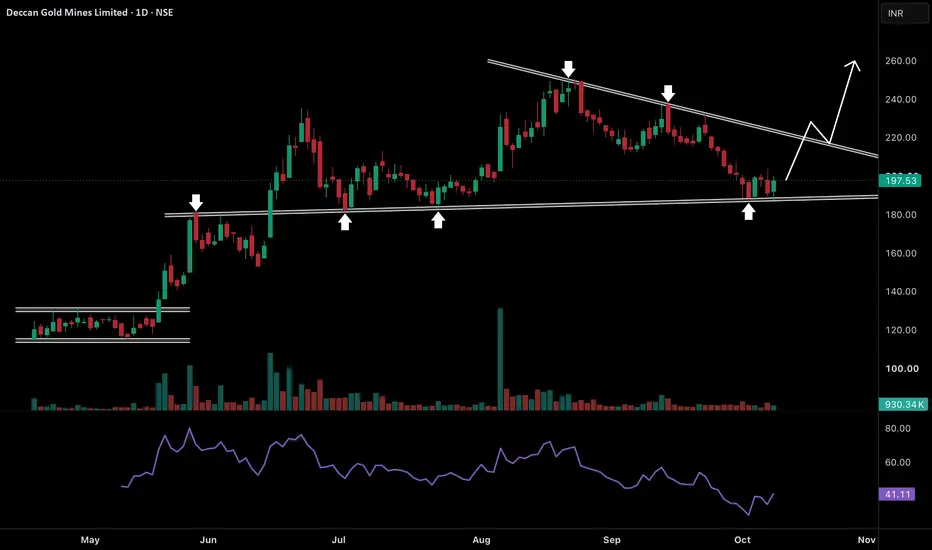
The stock is approaching an interesting stage where a strong bullish reversal could develop. If we observe the daily chart the stock has been forming a descending triangle with falling resistance and a gradually rising support trendline. Every recovery towards the upper trendline has attracted selling pressure but the interesting part is that buyers have repeatedly defended the 180–185 support region. This shows that despite multiple corrections sellers have failed to push price below this important zone. The stock has now returned towards the same support area and is showing early signs of recovery near 197. The structure is getting tighter as price moves closer to the point where both trendlines converge. Such compression often leads to a sharp directional move once either side loses control. RSI has also started recovering from lower levels which suggests selling momentum may be weakening.
What makes this setup particularly interesting is the possibility of a bullish breakout after several months of consolidation. The stock has already demonstrated its ability to rally strongly whenever buyers take control near support. If price continues holding above 185–190 we could see a recovery towards the falling resistance trendline around 215–225. This will be the most important zone because sellers have repeatedly defended it since August. A strong breakout and sustained move above this trendline could trap short sellers and attract fresh momentum buyers. Once 225–230 is cleared the stock could move towards 245–260 as marked on the chart. The longer price continues defending this support while resistance keeps getting tested the more interesting the breakout setup becomes. Buyers have an opportunity to turn this prolonged correction into a fresh bullish expansion phase.
What makes this setup particularly interesting is the possibility of a bullish breakout after several months of consolidation. The stock has already demonstrated its ability to rally strongly whenever buyers take control near support. If price continues holding above 185–190 we could see a recovery towards the falling resistance trendline around 215–225. This will be the most important zone because sellers have repeatedly defended it since August. A strong breakout and sustained move above this trendline could trap short sellers and attract fresh momentum buyers. Once 225–230 is cleared the stock could move towards 245–260 as marked on the chart. The longer price continues defending this support while resistance keeps getting tested the more interesting the breakout setup becomes. Buyers have an opportunity to turn this prolonged correction into a fresh bullish expansion phase.

📌 Join Trading Community 👇
Telegram : 👉telegram.me/chartifyy
Instagram: 👉 instagram.com/chartifyig?igsi=Y2ZiODZtczZ2aDA=&utm_source=qr
Telegram : 👉telegram.me/chartifyy
Instagram: 👉 instagram.com/chartifyig?igsi=Y2ZiODZtczZ2aDA=&utm_source=qr
Disclaimer
The information and publications are not meant to be, and do not constitute, financial, investment, trading, or other types of advice or recommendations supplied or endorsed by TradingView. Read more in the Terms of Use.
📌 Join Trading Community 👇
Telegram : 👉telegram.me/chartifyy
Instagram: 👉 instagram.com/chartifyig?igsi=Y2ZiODZtczZ2aDA=&utm_source=qr
Telegram : 👉telegram.me/chartifyy
Instagram: 👉 instagram.com/chartifyig?igsi=Y2ZiODZtczZ2aDA=&utm_source=qr
Disclaimer
The information and publications are not meant to be, and do not constitute, financial, investment, trading, or other types of advice or recommendations supplied or endorsed by TradingView. Read more in the Terms of Use.