
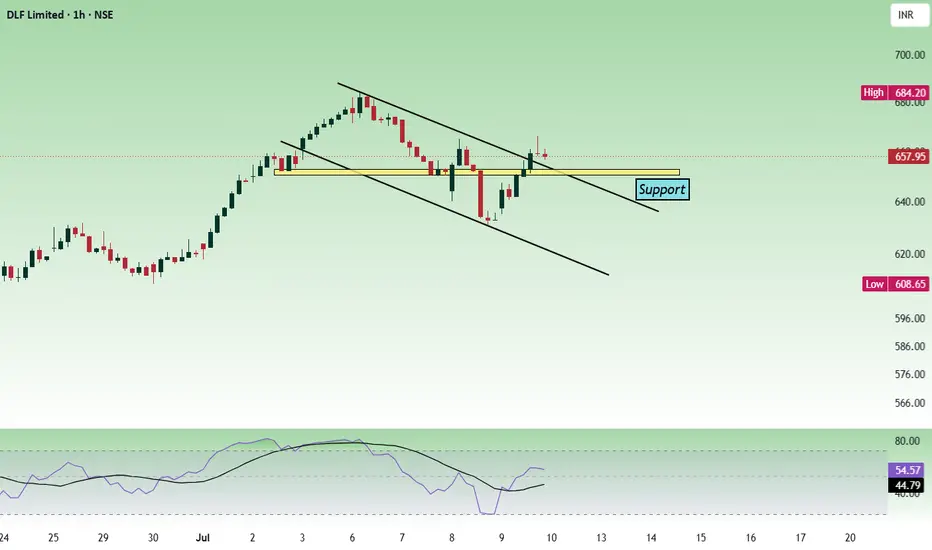
There are different patterns in the chart. in lower and higher time frames. In the lower time frame, the price is moving in a descending channel and in the daily time frame, the price is moving in an ascending channel.

Considering all these facts, if the price shows bullish strength at the 650 zone, the price can move up.
Buy above 654 with the stop loss of 648 for the targets 659, 666, 672, 680 and 688.
The price can test the upper trendline of the channel in the daily time frame.
Always do your analysis before taking any trade.
Considering all these facts, if the price shows bullish strength at the 650 zone, the price can move up.
Buy above 654 with the stop loss of 648 for the targets 659, 666, 672, 680 and 688.
The price can test the upper trendline of the channel in the daily time frame.
Always do your analysis before taking any trade.
Trade active
Long. T3 done. Trade closed: target reached
Done. The price is moving towards the upper trendline of the channel. 
Role I play here : Moderator. Follow me in telegram to trade better. t.me/Analysis4Newbie Contact information : tradingplan4u@gmail.com
Disclaimer
The information and publications are not meant to be, and do not constitute, financial, investment, trading, or other types of advice or recommendations supplied or endorsed by TradingView. Read more in the Terms of Use.
Role I play here : Moderator. Follow me in telegram to trade better. t.me/Analysis4Newbie Contact information : tradingplan4u@gmail.com
Disclaimer
The information and publications are not meant to be, and do not constitute, financial, investment, trading, or other types of advice or recommendations supplied or endorsed by TradingView. Read more in the Terms of Use.