
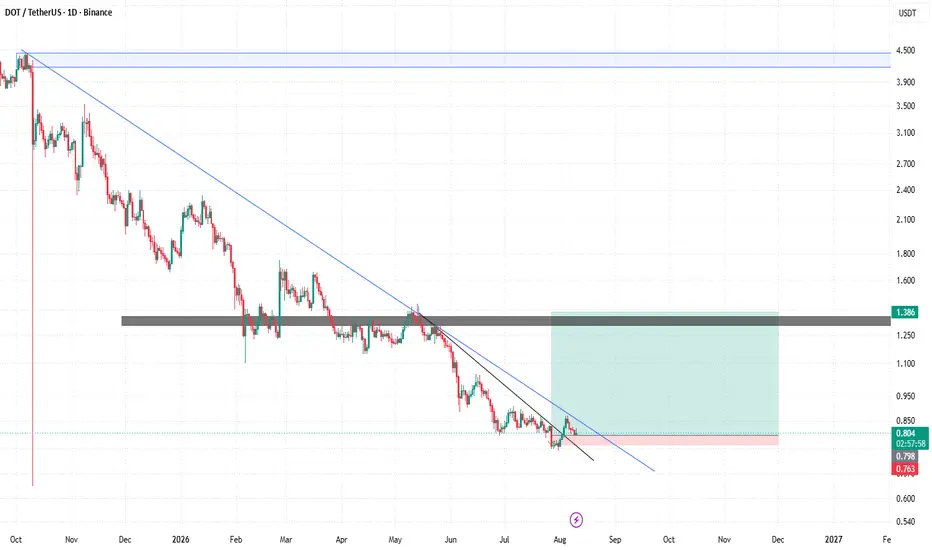
As you can see in the chart I drew R/R as a scale of 73%
Now, if a strong candle breaks the first blue horizontal, we can hope the price increases by 400%
Now, if a strong candle breaks the first blue horizontal, we can hope the price increases by 400%
Note
Stop hit, but it was a liquidity zone, and don't worry 
Disclaimer
The information and publications are not meant to be, and do not constitute, financial, investment, trading, or other types of advice or recommendations supplied or endorsed by TradingView. Read more in the Terms of Use.
Disclaimer
The information and publications are not meant to be, and do not constitute, financial, investment, trading, or other types of advice or recommendations supplied or endorsed by TradingView. Read more in the Terms of Use.