
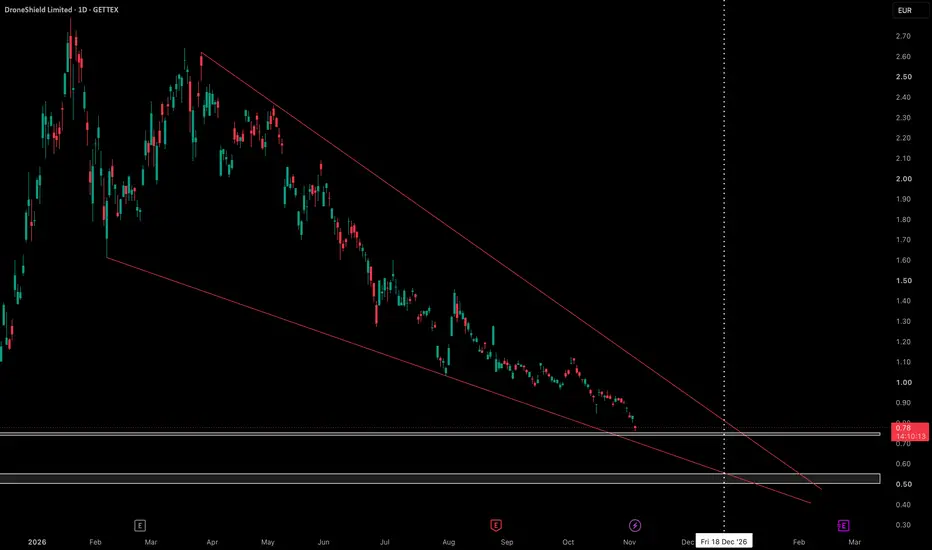
Something a little different from me, usually I'd post with a harmonic, unfortunately I can't quite find one as yet, but what I have been watching is this falling wedge which I think is aiming for 2 gaps from previous price action.
First gap the price is virtually at, the 2nd is lower between 0,55c and 0,50c and the vertical dotted line is my projected timeframe when the price meets the gap if we're going to run between the boundaries of the falling wedge.
As usual this isn't financial advice
First gap the price is virtually at, the 2nd is lower between 0,55c and 0,50c and the vertical dotted line is my projected timeframe when the price meets the gap if we're going to run between the boundaries of the falling wedge.
As usual this isn't financial advice

Disclaimer
The information and publications are not meant to be, and do not constitute, financial, investment, trading, or other types of advice or recommendations supplied or endorsed by TradingView. Read more in the Terms of Use.
Disclaimer
The information and publications are not meant to be, and do not constitute, financial, investment, trading, or other types of advice or recommendations supplied or endorsed by TradingView. Read more in the Terms of Use.