
Overview
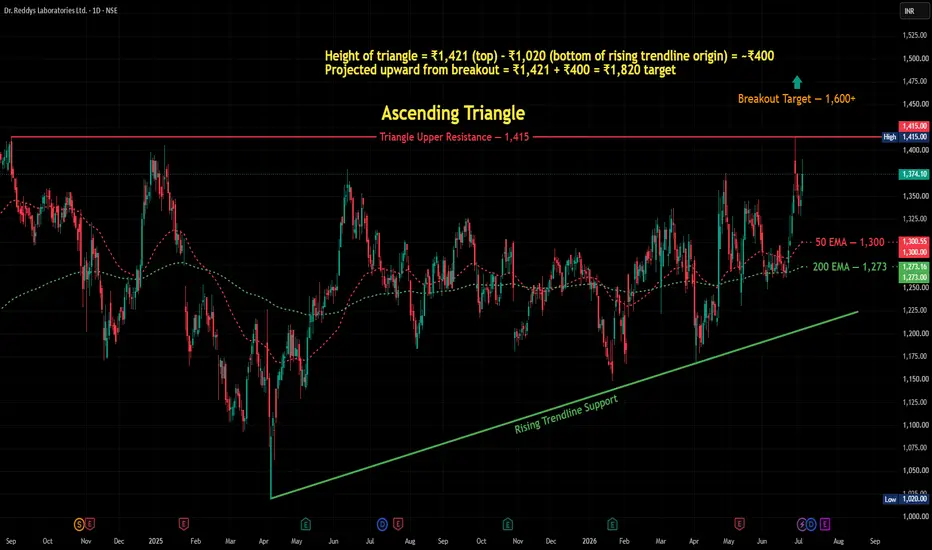
Dr. Reddy's Laboratories — one of India's leading pharmaceutical companies — is forming a well-defined Ascending Triangle on the Daily chart. Today's strong +2.11% session pushed price to ₹1,390, approaching the key resistance at ₹1,415, before closing at ₹1,374. The triangle structure remains intact and the breakout zone is approaching.
The Ascending Triangle
An Ascending Triangle forms when price makes higher lows (rising trendline below) while repeatedly testing a flat horizontal resistance above. This pattern signals accumulation — buyers are consistently stepping in at higher levels, pushing price toward the resistance ceiling.
Upper Boundary: Flat resistance at ₹1,415 — tested multiple times since 2024. Sellers have defended this level consistently. This is the key breakout trigger.
Lower Boundary: Rising trendline support connecting the lows from April 2025 through February 2026 — confirming buyers are making higher lows over time.
Today's Price Action — Why This Setup is Timely
Today's +2.11% session saw Dr. Reddy's rally to ₹1,390 — approaching but not yet breaking the ₹1,415 resistance. Price closed at ₹1,374, consolidating within the triangle structure. The ascending triangle remains fully intact.
The stock is in the compression zone — the narrowing space between rising support and flat resistance — where the next directional move is building energy.
The EMA Context
📈 50 EMA at ₹1,300 — price trading well above, confirming medium-term bullish momentum.
📈 200 EMA at ₹1,273 — price above the 200 EMA, confirming the long-term trend remains bullish.
Both EMAs are positioned as support layers below — adding depth to the bullish structure.
Key Levels
🔴 Triangle Upper Resistance — 1,415 (breakout trigger)
🟡 Current Price — 1,374 (inside triangle)
🟢 50 EMA Support — 1,300
🟢 200 EMA Support — 1,273
🟢 Rising Trendline Support — dynamic, rising from April 2025 lows
🎯 Measured Move Target — 1,820 (triangle height ₹400 projected from breakout at 1,415)
🔴 Invalidation — close below rising trendline
Two Scenarios
🟢 Scenario A — Breakout Confirms
Price breaks above ₹1,415 on a daily close with good volume. This confirms the Ascending Triangle breakout. First interim target is ₹1,600+, with a measured move target of ₹1,820 (triangle height of ~₹400 projected upward from the breakout level).
🔴 Scenario B — Resistance Holds, Pullback
Price fails to break above ₹1,415 and pulls back toward the rising trendline support. The triangle structure remains valid as long as price holds above the rising trendline. A close below the trendline would invalidate the pattern — watch the 50 EMA at ₹1,300 as the next support.
Beginner's Lesson — What is an Ascending Triangle?
An Ascending Triangle tells a story of shifting power from sellers to buyers:
The flat resistance shows sellers defending the same price level repeatedly
The rising trendline shows buyers becoming more aggressive — unwilling to wait for lower prices
As the two lines converge, pressure builds inside the pattern
Eventually buyers overwhelm sellers — and the breakout happens
The key insight: the pattern is bullish not because of the breakout, but because of the higher lows forming before it. Each higher low is a sign buyers are getting stronger.
Always wait for a confirmed daily close above ₹1,415 before acting — not just an intraday breach.
Conclusion
Dr. Reddy's is forming a clean Ascending Triangle on the Daily chart. The upper resistance at ₹1,415 is the key level — multiple tests, multiple rejections. But the rising trendline below shows buyers getting stronger with each pullback.
Watch for a daily close above ₹1,415 with volume — that is the confirmation signal.
For educational purposes only. Not financial advice. Always manage your risk.
Dr. Reddy's Laboratories — one of India's leading pharmaceutical companies — is forming a well-defined Ascending Triangle on the Daily chart. Today's strong +2.11% session pushed price to ₹1,390, approaching the key resistance at ₹1,415, before closing at ₹1,374. The triangle structure remains intact and the breakout zone is approaching.
The Ascending Triangle
An Ascending Triangle forms when price makes higher lows (rising trendline below) while repeatedly testing a flat horizontal resistance above. This pattern signals accumulation — buyers are consistently stepping in at higher levels, pushing price toward the resistance ceiling.
Upper Boundary: Flat resistance at ₹1,415 — tested multiple times since 2024. Sellers have defended this level consistently. This is the key breakout trigger.
Lower Boundary: Rising trendline support connecting the lows from April 2025 through February 2026 — confirming buyers are making higher lows over time.
Today's Price Action — Why This Setup is Timely
Today's +2.11% session saw Dr. Reddy's rally to ₹1,390 — approaching but not yet breaking the ₹1,415 resistance. Price closed at ₹1,374, consolidating within the triangle structure. The ascending triangle remains fully intact.
The stock is in the compression zone — the narrowing space between rising support and flat resistance — where the next directional move is building energy.
The EMA Context
📈 50 EMA at ₹1,300 — price trading well above, confirming medium-term bullish momentum.
📈 200 EMA at ₹1,273 — price above the 200 EMA, confirming the long-term trend remains bullish.
Both EMAs are positioned as support layers below — adding depth to the bullish structure.
Key Levels
🔴 Triangle Upper Resistance — 1,415 (breakout trigger)
🟡 Current Price — 1,374 (inside triangle)
🟢 50 EMA Support — 1,300
🟢 200 EMA Support — 1,273
🟢 Rising Trendline Support — dynamic, rising from April 2025 lows
🎯 Measured Move Target — 1,820 (triangle height ₹400 projected from breakout at 1,415)
🔴 Invalidation — close below rising trendline
Two Scenarios
🟢 Scenario A — Breakout Confirms
Price breaks above ₹1,415 on a daily close with good volume. This confirms the Ascending Triangle breakout. First interim target is ₹1,600+, with a measured move target of ₹1,820 (triangle height of ~₹400 projected upward from the breakout level).
🔴 Scenario B — Resistance Holds, Pullback
Price fails to break above ₹1,415 and pulls back toward the rising trendline support. The triangle structure remains valid as long as price holds above the rising trendline. A close below the trendline would invalidate the pattern — watch the 50 EMA at ₹1,300 as the next support.
Beginner's Lesson — What is an Ascending Triangle?
An Ascending Triangle tells a story of shifting power from sellers to buyers:
The flat resistance shows sellers defending the same price level repeatedly
The rising trendline shows buyers becoming more aggressive — unwilling to wait for lower prices
As the two lines converge, pressure builds inside the pattern
Eventually buyers overwhelm sellers — and the breakout happens
The key insight: the pattern is bullish not because of the breakout, but because of the higher lows forming before it. Each higher low is a sign buyers are getting stronger.
Always wait for a confirmed daily close above ₹1,415 before acting — not just an intraday breach.
Conclusion
Dr. Reddy's is forming a clean Ascending Triangle on the Daily chart. The upper resistance at ₹1,415 is the key level — multiple tests, multiple rejections. But the rising trendline below shows buyers getting stronger with each pullback.
Watch for a daily close above ₹1,415 with volume — that is the confirmation signal.
For educational purposes only. Not financial advice. Always manage your risk.

📈 HK Trading Community | Market Structure & Indicator Updates
Telegram: t.me/trendstrike1000
Website: quantumedgepro.netlify.app/
Real traders are built through learning,not tip hunting.So Start Learning How the Market Really Works
Telegram: t.me/trendstrike1000
Website: quantumedgepro.netlify.app/
Real traders are built through learning,not tip hunting.So Start Learning How the Market Really Works
Disclaimer
The information and publications are not meant to be, and do not constitute, financial, investment, trading, or other types of advice or recommendations supplied or endorsed by TradingView. Read more in the Terms of Use.
📈 HK Trading Community | Market Structure & Indicator Updates
Telegram: t.me/trendstrike1000
Website: quantumedgepro.netlify.app/
Real traders are built through learning,not tip hunting.So Start Learning How the Market Really Works
Telegram: t.me/trendstrike1000
Website: quantumedgepro.netlify.app/
Real traders are built through learning,not tip hunting.So Start Learning How the Market Really Works
Disclaimer
The information and publications are not meant to be, and do not constitute, financial, investment, trading, or other types of advice or recommendations supplied or endorsed by TradingView. Read more in the Terms of Use.