
Overview
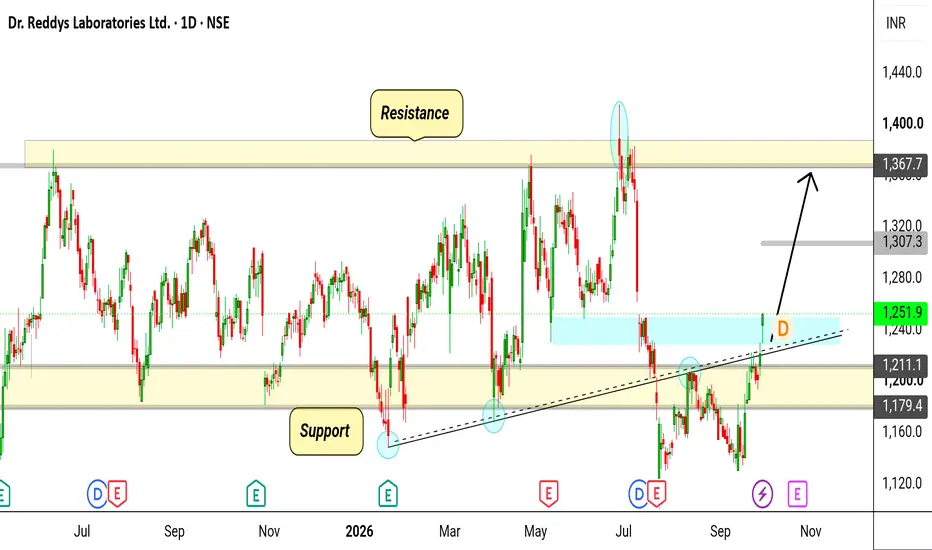
Dr. Reddy’s Laboratories Ltd. (NSE: DRREDDY) is displaying a clear technical reversal structure on the daily timeframe. After testing a strong horizontal support base near ₹1,180 – ₹1,211 (confluent with an ascending trendline support), price action has printed a sharp bullish momentum candle.
The stock is bouncing off a key liquidity area around ₹1,240–₹1,250 with expanding green candles, signalling strong buyer interest for a potential continuation toward major resistance levels.
📉 Technical Analysis
Ascending Support Trendline:
A multi-month rising trendline (connecting major higher lows from late 2025 to mid-2026) continues to act as a solid floor.
The recent swing low held firmly above this ascending trendline and key horizontal demand zone (₹1,180 – ₹1,211).
Key Levels Breakdown:
Demand Zone / Main Support: ₹1,180.0 – ₹1,211.0
Immediate Resistance / Mid Target: ₹1,307.3
Major Resistance Target: ₹1,367.7 – ₹1,400.0
Price Action & Structure:
Price recently broke back above the immediate micro-resistance (~₹1,240) and is currently trading around ₹1,251.9.
The structural path anticipates a move toward intermediate resistance at ₹1,307.3, with potential extended momentum testing the upper supply zone around ₹1,367.7+.
📊 Fundamental Context
Industry Leadership: As one of India’s top pharmaceutical exporters, Dr. Reddy's maintains strong revenue visibility across North America, India, and Emerging Markets.
Diversified Pipeline: Steady growth in generic formulation launches, biosimilar pipeline progress, and specialized active pharmaceutical ingredients (APIs) back medium-to-long term structural growth.
Post-Split Valuation Adjustment: Adjusted valuations following the late-2024 1:5 stock split have increased retail liquidity, keeping overall institutional accumulation steady along key technical support bands.
💡 Trade Setup Scenario (Swing Long)
Entry Zone: ₹1,240 – ₹1,255
Target 1: ₹1,307
Target 2: ₹1,367
Stop Loss (SL): Below ₹1,200 (Closing basis below ascending trendline support)
Risk/Reward Ratio: ~1:2.5+
⚠️ Disclaimer: This analysis is shared purely for educational and informational purposes and does not constitute financial advice, investment recommendation, or an offer to buy/sell securities. Technical analysis is based on historical price patterns and current chart structures, which may change. Always perform your own research and manage risk appropriately before placing any trades.
Dr. Reddy’s Laboratories Ltd. (NSE: DRREDDY) is displaying a clear technical reversal structure on the daily timeframe. After testing a strong horizontal support base near ₹1,180 – ₹1,211 (confluent with an ascending trendline support), price action has printed a sharp bullish momentum candle.
The stock is bouncing off a key liquidity area around ₹1,240–₹1,250 with expanding green candles, signalling strong buyer interest for a potential continuation toward major resistance levels.
📉 Technical Analysis
Ascending Support Trendline:
A multi-month rising trendline (connecting major higher lows from late 2025 to mid-2026) continues to act as a solid floor.
The recent swing low held firmly above this ascending trendline and key horizontal demand zone (₹1,180 – ₹1,211).
Key Levels Breakdown:
Demand Zone / Main Support: ₹1,180.0 – ₹1,211.0
Immediate Resistance / Mid Target: ₹1,307.3
Major Resistance Target: ₹1,367.7 – ₹1,400.0
Price Action & Structure:
Price recently broke back above the immediate micro-resistance (~₹1,240) and is currently trading around ₹1,251.9.
The structural path anticipates a move toward intermediate resistance at ₹1,307.3, with potential extended momentum testing the upper supply zone around ₹1,367.7+.
📊 Fundamental Context
Industry Leadership: As one of India’s top pharmaceutical exporters, Dr. Reddy's maintains strong revenue visibility across North America, India, and Emerging Markets.
Diversified Pipeline: Steady growth in generic formulation launches, biosimilar pipeline progress, and specialized active pharmaceutical ingredients (APIs) back medium-to-long term structural growth.
Post-Split Valuation Adjustment: Adjusted valuations following the late-2024 1:5 stock split have increased retail liquidity, keeping overall institutional accumulation steady along key technical support bands.
💡 Trade Setup Scenario (Swing Long)
Entry Zone: ₹1,240 – ₹1,255
Target 1: ₹1,307
Target 2: ₹1,367
Stop Loss (SL): Below ₹1,200 (Closing basis below ascending trendline support)
Risk/Reward Ratio: ~1:2.5+
⚠️ Disclaimer: This analysis is shared purely for educational and informational purposes and does not constitute financial advice, investment recommendation, or an offer to buy/sell securities. Technical analysis is based on historical price patterns and current chart structures, which may change. Always perform your own research and manage risk appropriately before placing any trades.

Disclaimer
The information and publications are not meant to be, and do not constitute, financial, investment, trading, or other types of advice or recommendations supplied or endorsed by TradingView. Read more in the Terms of Use.
Disclaimer
The information and publications are not meant to be, and do not constitute, financial, investment, trading, or other types of advice or recommendations supplied or endorsed by TradingView. Read more in the Terms of Use.