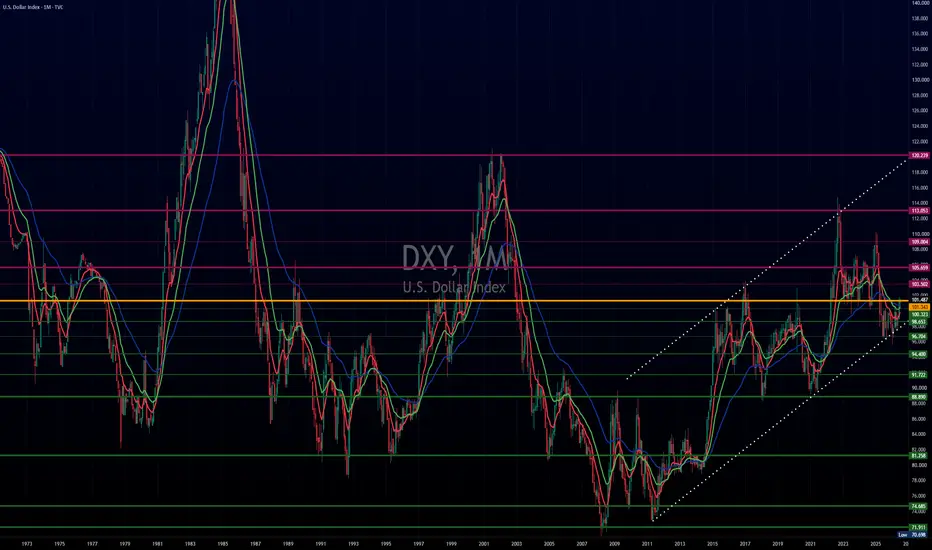
When you zoom out to a multi decade monthly perspective, mapping the dollar becomes a relative game. Unlike yields,  DXY isn't just reacting to domestic policy, it reflects a relative basket against the Euro, Yen, and Sterling.
Right now, price is battling at the single most important structural pivot on the entire monthly chart: the orange horizontal line around 101.
Why This Level Holds Multi Decade Weight
1) Polarity Shift (Resistance Turned Support Turned Resistance):
Late 1980s: Following the post 1985 collapse, counter trend rallies in the late 1980’s hit a hard ceiling at 101, acting as primary overhead resistance.
Late 1990s / Early 2000s: Once price reclaimed it, 101 acted as key structural support during the dot com era expansion, until it gave way in 2003.
Post 2015 Regime: Reverted back to a multi year ceiling throughout 2015 -2020, before converting into the launchpad for the massive 2022 rally. In 2025 it gave way and we are here again, testing this 101 level.
2) Confluence with the Macro Channel:
This horizontal level directly intersects with the lower boundary of the long term ascending channel (dotted lines).
What Monthly Acceptance Means From Here
Clean Acceptance Above 101: Validates the higher low structure inside the multi year channel. This opens the runway for a liquidity expansion toward 105, 110, and eventually a retest of the 113–114 cycle highs.
Rejection / Breakdown Below 101: Losing this zone and breaking under the channel shifts the macro structure from an ascending continuation into a broad multi year topping pattern.
DXY isn't just reacting to domestic policy, it reflects a relative basket against the Euro, Yen, and Sterling.Right now, price is battling at the single most important structural pivot on the entire monthly chart: the orange horizontal line around 101.
Why This Level Holds Multi Decade Weight
1) Polarity Shift (Resistance Turned Support Turned Resistance):
Late 1980s: Following the post 1985 collapse, counter trend rallies in the late 1980’s hit a hard ceiling at 101, acting as primary overhead resistance.
Late 1990s / Early 2000s: Once price reclaimed it, 101 acted as key structural support during the dot com era expansion, until it gave way in 2003.
Post 2015 Regime: Reverted back to a multi year ceiling throughout 2015 -2020, before converting into the launchpad for the massive 2022 rally. In 2025 it gave way and we are here again, testing this 101 level.
2) Confluence with the Macro Channel:
This horizontal level directly intersects with the lower boundary of the long term ascending channel (dotted lines).
What Monthly Acceptance Means From Here
Clean Acceptance Above 101: Validates the higher low structure inside the multi year channel. This opens the runway for a liquidity expansion toward 105, 110, and eventually a retest of the 113–114 cycle highs.
Rejection / Breakdown Below 101: Losing this zone and breaking under the channel shifts the macro structure from an ascending continuation into a broad multi year topping pattern.

Related publications
Disclaimer
The information and publications are not meant to be, and do not constitute, financial, investment, trading, or other types of advice or recommendations supplied or endorsed by TradingView. Read more in the Terms of Use.
Related publications
Disclaimer
The information and publications are not meant to be, and do not constitute, financial, investment, trading, or other types of advice or recommendations supplied or endorsed by TradingView. Read more in the Terms of Use.