
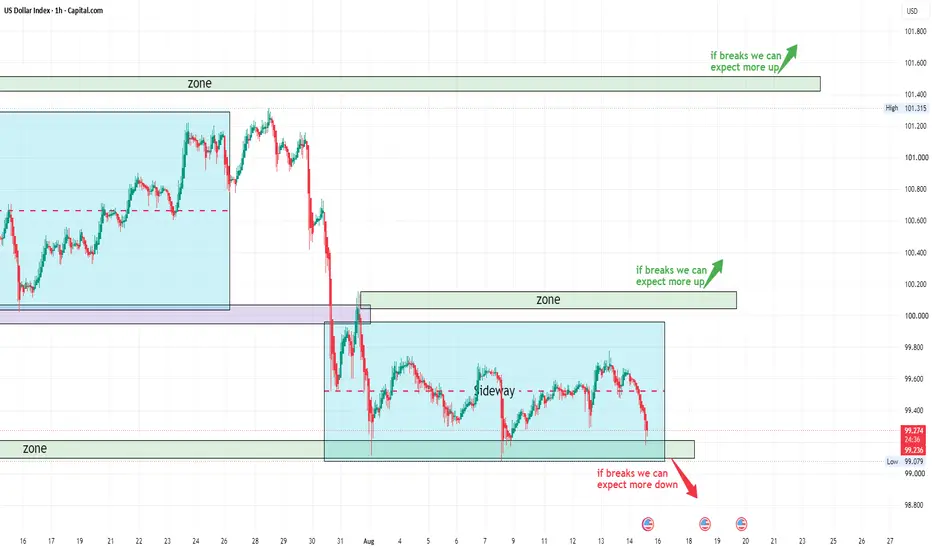
💰The U.S. Dollar Index has spent the last several sessions trapped inside a clear sideways structure, with price repeatedly moving between the upper and lower boundaries.
🏆Previously:
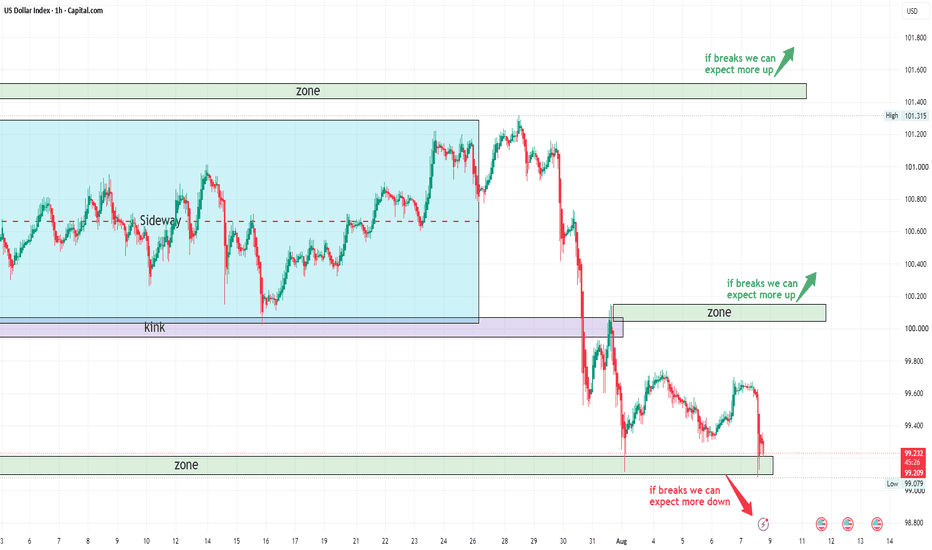
Now DXY is pressing the lower zone around 99.1–99.3 — and this is where the chart gets interesting. 👀
📈 Bullish scenario
If DXY can reclaim the 100.0–100.2 zone and break out of the current structure, we could see another bullish expansion.
The next major upside zone sits around 101.4–101.6.
A confirmed breakout from the sideways range would be a strong sign that the dollar is ready to leave this compression behind.
📉 Bearish scenario
Right now, price is testing the lower support zone around 99.1.
If that zone breaks and price accepts below it, the sideways structure could resolve to the downside, opening the door for further weakness.
This is the key level to watch for the bearish scenario.
🎯 Outlook
DXY has been compressing inside this range for weeks.
The longer price stays trapped, the more interesting the eventual breakout becomes.
99.1 is the floor. 100.0–100.2 is the ceiling.
Whichever side breaks first could decide the next major move. ⚔️

🥇“The Z impact” trading team is here to help new traders with technical analytics and fundamentals.
⚜️Mostly trading indicators
📞Support: t.me/theZSupport
💎Our website: TradeZimpact.com
💡Our Channel: t.me/TheZimpact
⚜️Mostly trading indicators
📞Support: t.me/theZSupport
💎Our website: TradeZimpact.com
💡Our Channel: t.me/TheZimpact
Related publications
Disclaimer
The information and publications are not meant to be, and do not constitute, financial, investment, trading, or other types of advice or recommendations supplied or endorsed by TradingView. Read more in the Terms of Use.
🥇“The Z impact” trading team is here to help new traders with technical analytics and fundamentals.
⚜️Mostly trading indicators
📞Support: t.me/theZSupport
💎Our website: TradeZimpact.com
💡Our Channel: t.me/TheZimpact
⚜️Mostly trading indicators
📞Support: t.me/theZSupport
💎Our website: TradeZimpact.com
💡Our Channel: t.me/TheZimpact
Related publications
Disclaimer
The information and publications are not meant to be, and do not constitute, financial, investment, trading, or other types of advice or recommendations supplied or endorsed by TradingView. Read more in the Terms of Use.