
Stock Summary
eClerx Services is an IT/ITES company providing business process management, automation, and data analytics solutions to Fortune 2000 enterprises across financial services, digital retail, and technology.
Current Price: 1,925.30 (+4.32% intraday)
Day High / Low: 1,935.50 / 1,852.00
Key Support (Buy Stop): 1,834.80
52-Week / Structural Anchors: Q1 High: 1,714.00 | Q2 Low: 1,462.00
Stock Chart Analysis.
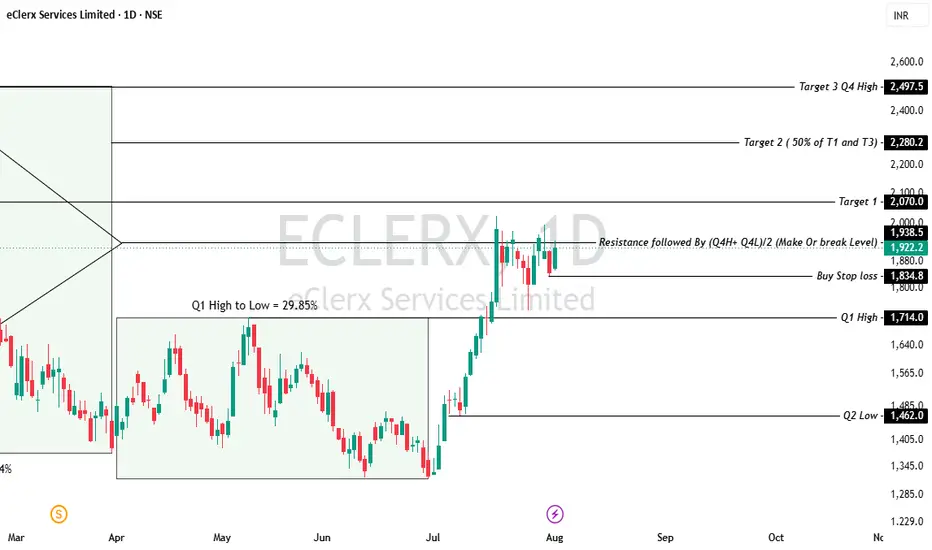
The stock has completed a prolonged bottoming consolidation pattern between 1,300 and 1,714 and successfully broke out above the key Q1High of 1,714.00. It is currently encountering mid-range consolidation right at a major pivot resistance line:
Make-or-Break Pivot Level: 1,938.50 The current price at 1,925.30 is testing this exact zone.
Support Zone: Strong structural demand around 1,834.80–1,850.00 (Buy Stop level).
Pattern Structure: Higher-highs and higher-lows formation following a breakout from a 30% range contraction box
Recent Updates and News
Earnings Watch: The upcoming Board Meeting is scheduled for August 5, 2026 to consider and approve the quarterly financial results for the quarter ended June 30.
Exchange Query: Exchange sought clarification on July 22, 2026 regarding significant price movement, indicating strong speculative momentum leading up to earnings.
Management & Strategic Additions: Recent leadership appointment of Principal – Customer Experience, alongside expansion in delivery centers (Cairo, Egypt) to support international operational growth.
Forecast
Bullish Scenario: A sustained daily closing above 1,938.50 unlocks a fast path toward Target 1 (2,070.00) and subsequent Fibonacci/structural expansion targets.
Bearish Scenario: Rejection at 1,938.50 could trigger a retest of the lower support around 1,834.80 or the former breakout boundary near 1,714.00.
Trade Idea & Projection Summary
Buy / Entry Zone: 1,920 – 1,938 (Immediate breakout entry above 1,938.50 or on a pullback to 1,850)
Stop Loss: 1,834.80 (Placed below the key daily swing low structure
Target 1: 2,070.00 (Immediate structural resistance target)
Target 2: 2,280.20 (Mid-point target at the 50% level between Target 1 and Target 3)
Target 3: 2,497.50 (Major multi-quarter target matching the Q4 High)
Disclaimer: aliceblueonline.com/legal-documentation/disclaimer
eClerx Services is an IT/ITES company providing business process management, automation, and data analytics solutions to Fortune 2000 enterprises across financial services, digital retail, and technology.
Current Price: 1,925.30 (+4.32% intraday)
Day High / Low: 1,935.50 / 1,852.00
Key Support (Buy Stop): 1,834.80
52-Week / Structural Anchors: Q1 High: 1,714.00 | Q2 Low: 1,462.00
Stock Chart Analysis.
The stock has completed a prolonged bottoming consolidation pattern between 1,300 and 1,714 and successfully broke out above the key Q1High of 1,714.00. It is currently encountering mid-range consolidation right at a major pivot resistance line:
Make-or-Break Pivot Level: 1,938.50 The current price at 1,925.30 is testing this exact zone.
Support Zone: Strong structural demand around 1,834.80–1,850.00 (Buy Stop level).
Pattern Structure: Higher-highs and higher-lows formation following a breakout from a 30% range contraction box
Recent Updates and News
Earnings Watch: The upcoming Board Meeting is scheduled for August 5, 2026 to consider and approve the quarterly financial results for the quarter ended June 30.
Exchange Query: Exchange sought clarification on July 22, 2026 regarding significant price movement, indicating strong speculative momentum leading up to earnings.
Management & Strategic Additions: Recent leadership appointment of Principal – Customer Experience, alongside expansion in delivery centers (Cairo, Egypt) to support international operational growth.
Forecast
Bullish Scenario: A sustained daily closing above 1,938.50 unlocks a fast path toward Target 1 (2,070.00) and subsequent Fibonacci/structural expansion targets.
Bearish Scenario: Rejection at 1,938.50 could trigger a retest of the lower support around 1,834.80 or the former breakout boundary near 1,714.00.
Trade Idea & Projection Summary
Buy / Entry Zone: 1,920 – 1,938 (Immediate breakout entry above 1,938.50 or on a pullback to 1,850)
Stop Loss: 1,834.80 (Placed below the key daily swing low structure
Target 1: 2,070.00 (Immediate structural resistance target)
Target 2: 2,280.20 (Mid-point target at the 50% level between Target 1 and Target 3)
Target 3: 2,497.50 (Major multi-quarter target matching the Q4 High)
Disclaimer: aliceblueonline.com/legal-documentation/disclaimer

Disclaimer
The information and publications are not meant to be, and do not constitute, financial, investment, trading, or other types of advice or recommendations supplied or endorsed by TradingView. Read more in the Terms of Use.
Disclaimer
The information and publications are not meant to be, and do not constitute, financial, investment, trading, or other types of advice or recommendations supplied or endorsed by TradingView. Read more in the Terms of Use.