
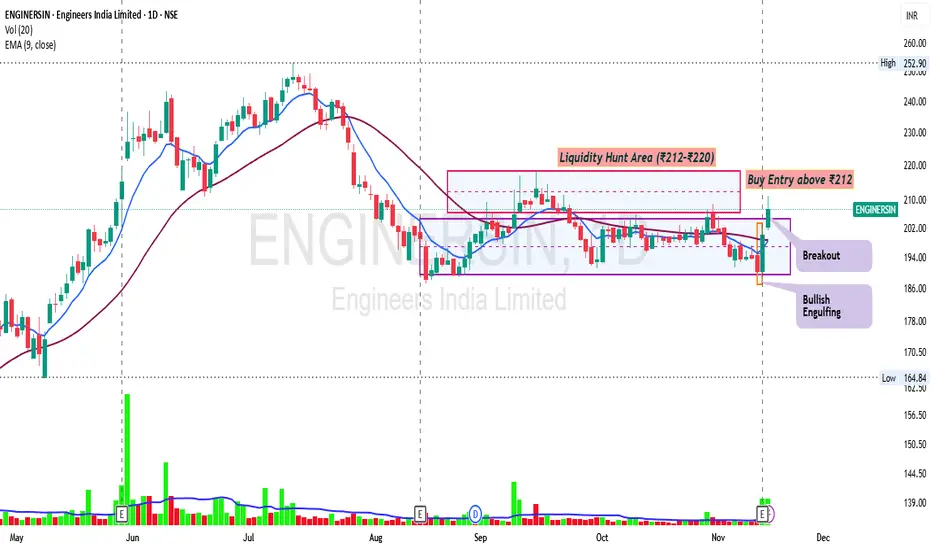
Pattern Formation
Breakout Behaviour
Candlestick Pattern
Target Setup
Entry: Above ₹212
Stop-Loss: ₹196
Targets:
T1: ₹220
T2: ₹228
T3: ₹235
Disclaimer
This analysis is for educational purposes only. Not investment advice. Traders should manage risk and do their own analysis.
- The stock is moving inside a sideways accumulation range between ₹188–₹200.
- Multiple swing highs formed in the ₹212–₹220 region created a liquidity pool.
- Price repeatedly wicked above these highs, indicating Buy-Side Liquidity Hunt.
Breakout Behaviour
- A strong bullish candle broke above the short-term descending line.
- Sustaining above ₹212 will confirm a true breakout from the liquidity zone.
Candlestick Pattern
- A strong bullish reversal candle formed at the accumulation low.
- This candle marks the origin of the new bullish move.
Target Setup
Entry: Above ₹212
Stop-Loss: ₹196
Targets:
T1: ₹220
T2: ₹228
T3: ₹235
Disclaimer
This analysis is for educational purposes only. Not investment advice. Traders should manage risk and do their own analysis.

Disclaimer
The information and publications are not meant to be, and do not constitute, financial, investment, trading, or other types of advice or recommendations supplied or endorsed by TradingView. Read more in the Terms of Use.
Disclaimer
The information and publications are not meant to be, and do not constitute, financial, investment, trading, or other types of advice or recommendations supplied or endorsed by TradingView. Read more in the Terms of Use.