
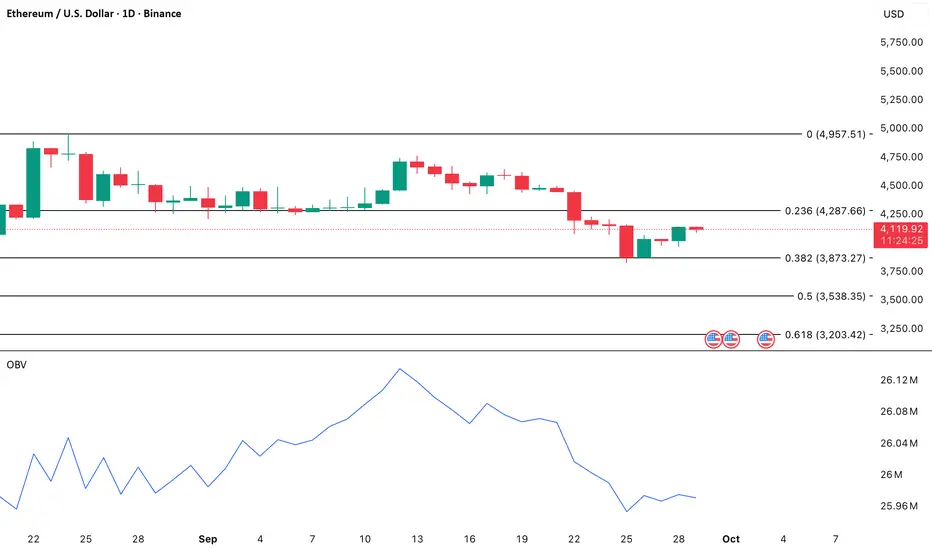
ETH/USD is showing signs of fragility as spot market participation weakens. Since September 12, the On-Balance Volume (OBV) indicator has trended downward, highlighting fading buyer demand in the market.
The OBV measures cumulative trading volume by adding volume on bullish days and subtracting it on bearish days. A rising OBV typically reflects strong buyer momentum driving prices higher, while a decline suggests that sellers are gaining the upper hand.
With ETH’s OBV steadily falling, it signals that selling pressure currently outweighs buying activity. This imbalance amplifies downside risks and raises concerns about whether Ethereum can maintain support above the critical $4,000 level in the coming weeks.
The OBV measures cumulative trading volume by adding volume on bullish days and subtracting it on bearish days. A rising OBV typically reflects strong buyer momentum driving prices higher, while a decline suggests that sellers are gaining the upper hand.
With ETH’s OBV steadily falling, it signals that selling pressure currently outweighs buying activity. This imbalance amplifies downside risks and raises concerns about whether Ethereum can maintain support above the critical $4,000 level in the coming weeks.

Leader in crypto news, award winning journalism in 26 languages.
Disclaimer
The information and publications are not meant to be, and do not constitute, financial, investment, trading, or other types of advice or recommendations supplied or endorsed by TradingView. Read more in the Terms of Use.
Leader in crypto news, award winning journalism in 26 languages.
Disclaimer
The information and publications are not meant to be, and do not constitute, financial, investment, trading, or other types of advice or recommendations supplied or endorsed by TradingView. Read more in the Terms of Use.