
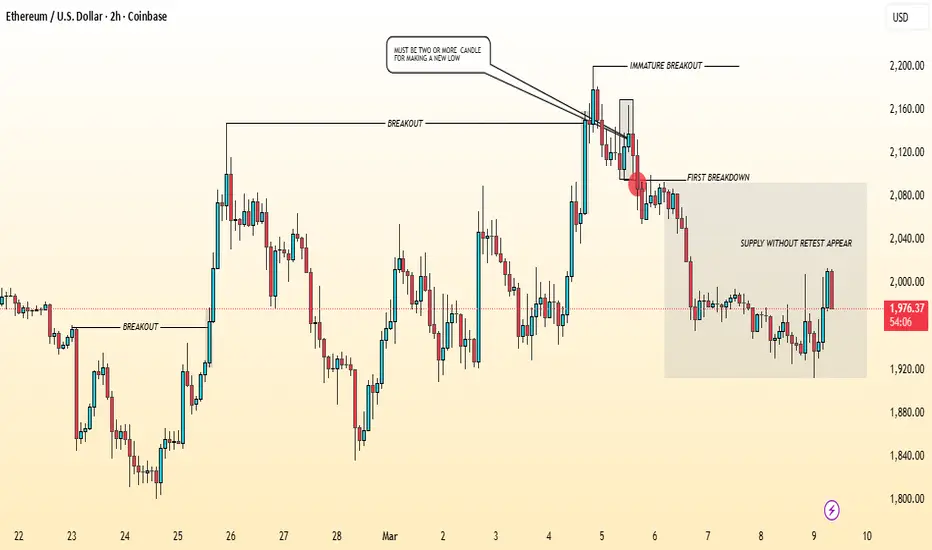
1️⃣ Initial Breakout (Accumulation Expansion)
Price breaks above a previous range around Feb 25–26.
This breakout confirms buyers taking control and initiating a new short-term bullish structure.
However, the market does not trend strongly afterward; instead it moves sideways.
📌 Interpretation:
The breakout created liquidity above, but momentum wasn't sustained.
2️⃣ Liquidity Sweep & “Immature Breakout”
Around March 5:
Price spikes above the previous high.
The breakout happens too quickly without strong structure building.
This is labeled in your chart as “immature breakout.”
📌 What it means:
Institutions often push price above highs to grab liquidity (buy stops).
Once liquidity is taken, smart money distributes positions.
Result → Immediate rejection.
3️⃣ First Breakdown (Market Structure Shift)
After the rejection:
Price breaks the minor structure low.
This is your first breakdown, marking a short-term bearish shift.
📌 Important concept:
Your note “must be two or more candles for making a new low” highlights confirmation of structure break, not just a wick.
This confirms sell-side control.
4️⃣ Supply Without Retest
After the breakdown:
Price drops aggressively.
It never retests the supply zone where the breakdown started.
📌 Meaning:
Sellers were strong and impatient.
This usually leaves inefficiency or imbalance above.
That zone often becomes a future target.
5️⃣ Current Price Action (Range / Reaccumulation)
Price is now moving inside the grey consolidation box around $1920 – $2000.
Characteristics:
Small candles
Equal highs/lows forming
Liquidity building
📌 This is compression before expansion.
⚠️ Key Levels
Resistance / Supply
$2050 – $2100 → breakdown origin
Range High
~$2000
Range Low
~$1920
Liquidity Below
$1880 area
📈 Possible Scenarios
Bullish Scenario
If price breaks above $2000–$2020:
Targets:
$2050
$2100 supply retest
Reason:
Liquidity sweep + imbalance fill.
Bearish Scenario
If price breaks below $1920:
Targets:
$1880
$1840
Reason:
Range liquidity sweep to the downside.
🧠 Key Market Concept Demonstrated
Your chart nicely shows:
Breakout → Liquidity Grab → Distribution → Breakdown → Consolidation
This is smart money behavior around liquidity pools.
✅ My Short Summary
Ethereum grabbed liquidity above highs with an immature breakout, shifted bearish with a confirmed breakdown, and is now consolidating while building liquidity for the next directional move.
Price breaks above a previous range around Feb 25–26.
This breakout confirms buyers taking control and initiating a new short-term bullish structure.
However, the market does not trend strongly afterward; instead it moves sideways.
📌 Interpretation:
The breakout created liquidity above, but momentum wasn't sustained.
2️⃣ Liquidity Sweep & “Immature Breakout”
Around March 5:
Price spikes above the previous high.
The breakout happens too quickly without strong structure building.
This is labeled in your chart as “immature breakout.”
📌 What it means:
Institutions often push price above highs to grab liquidity (buy stops).
Once liquidity is taken, smart money distributes positions.
Result → Immediate rejection.
3️⃣ First Breakdown (Market Structure Shift)
After the rejection:
Price breaks the minor structure low.
This is your first breakdown, marking a short-term bearish shift.
📌 Important concept:
Your note “must be two or more candles for making a new low” highlights confirmation of structure break, not just a wick.
This confirms sell-side control.
4️⃣ Supply Without Retest
After the breakdown:
Price drops aggressively.
It never retests the supply zone where the breakdown started.
📌 Meaning:
Sellers were strong and impatient.
This usually leaves inefficiency or imbalance above.
That zone often becomes a future target.
5️⃣ Current Price Action (Range / Reaccumulation)
Price is now moving inside the grey consolidation box around $1920 – $2000.
Characteristics:
Small candles
Equal highs/lows forming
Liquidity building
📌 This is compression before expansion.
⚠️ Key Levels
Resistance / Supply
$2050 – $2100 → breakdown origin
Range High
~$2000
Range Low
~$1920
Liquidity Below
$1880 area
📈 Possible Scenarios
Bullish Scenario
If price breaks above $2000–$2020:
Targets:
$2050
$2100 supply retest
Reason:
Liquidity sweep + imbalance fill.
Bearish Scenario
If price breaks below $1920:
Targets:
$1880
$1840
Reason:
Range liquidity sweep to the downside.
🧠 Key Market Concept Demonstrated
Your chart nicely shows:
Breakout → Liquidity Grab → Distribution → Breakdown → Consolidation
This is smart money behavior around liquidity pools.
✅ My Short Summary
Ethereum grabbed liquidity above highs with an immature breakout, shifted bearish with a confirmed breakdown, and is now consolidating while building liquidity for the next directional move.

Disclaimer
The information and publications are not meant to be, and do not constitute, financial, investment, trading, or other types of advice or recommendations supplied or endorsed by TradingView. Read more in the Terms of Use.
Disclaimer
The information and publications are not meant to be, and do not constitute, financial, investment, trading, or other types of advice or recommendations supplied or endorsed by TradingView. Read more in the Terms of Use.