
Ethereum has already lost the $2,000 level, and that changes the tone of this chart completely. What used to act as support is now at risk of turning into resistance. Here's the map.
🗺️ Ethan Map
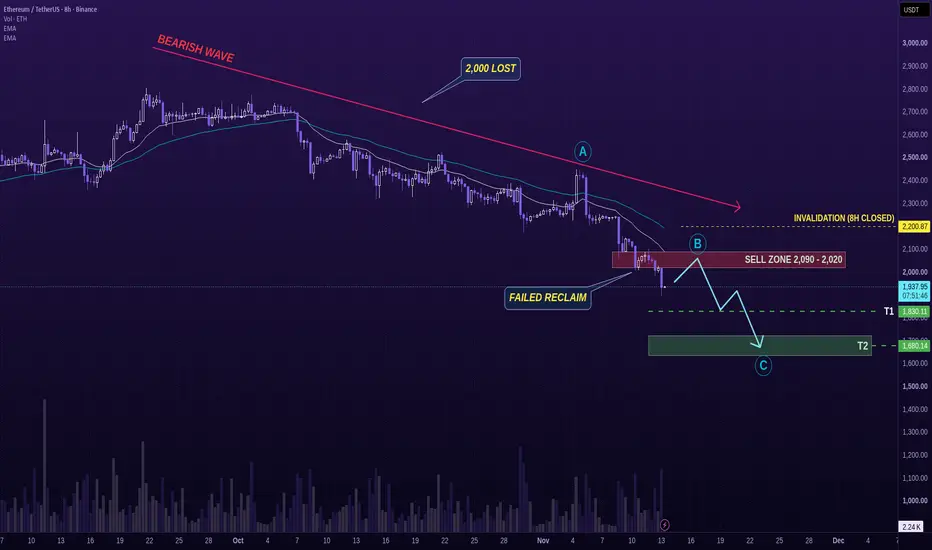
Ⓐ The structure: ETH remains in a clear bearish wave on the 8H chart. Price is trading below both EMA 21 and EMA 50, while the broader sequence still points to lower highs and lower lows. The loss of $2,000 is the key technical shift here.
Ⓑ The entry: I am watching the sell zone at $2,020–$2,090. I do not want to chase price at the lows. I want to see ETH bounce into that zone, fail to reclaim strength, and then show rejection before looking for shorts.
Ⓒ The targets: T1 is $1,830.11, which is the first major downside area on the chart. If selling pressure continues and that level gives way, the next objective is the deeper T2 zone around $1,678.25.
📅 Macro check
US inflation has remained sticky enough to keep pressure on risk assets, and that still supports the bearish side for crypto in the short term. The next macro catalyst is US PPI, which could decide whether this bounce attempt has room to grow or gets sold again.
🔄 Plan B
An 8H close above $2,200.87 invalidates this bearish setup. If ETH reclaims that level, the current map is no longer valid and I step aside.
📐 Trade Plan
Entry: $2,020–$2,090
Invalidation: 8H close above $2,200.87
T1: $1,830.11
T2: $1,678.25 zone
R:R: ~1.54R to T1, ~2.58R to T2 from a mid-zone entry
🧬 Ethan Rule: Update the map. Don’t defend it.
ETH has already changed the map by losing $2,000, so clinging to the old support story no longer helps.
Would you wait for the bounce into the sell zone, or stay away until the next clean rejection appears?
🗺️ Ethan Map
Ⓐ The structure: ETH remains in a clear bearish wave on the 8H chart. Price is trading below both EMA 21 and EMA 50, while the broader sequence still points to lower highs and lower lows. The loss of $2,000 is the key technical shift here.
Ⓑ The entry: I am watching the sell zone at $2,020–$2,090. I do not want to chase price at the lows. I want to see ETH bounce into that zone, fail to reclaim strength, and then show rejection before looking for shorts.
Ⓒ The targets: T1 is $1,830.11, which is the first major downside area on the chart. If selling pressure continues and that level gives way, the next objective is the deeper T2 zone around $1,678.25.
📅 Macro check
US inflation has remained sticky enough to keep pressure on risk assets, and that still supports the bearish side for crypto in the short term. The next macro catalyst is US PPI, which could decide whether this bounce attempt has room to grow or gets sold again.
🔄 Plan B
An 8H close above $2,200.87 invalidates this bearish setup. If ETH reclaims that level, the current map is no longer valid and I step aside.
📐 Trade Plan
Entry: $2,020–$2,090
Invalidation: 8H close above $2,200.87
T1: $1,830.11
T2: $1,678.25 zone
R:R: ~1.54R to T1, ~2.58R to T2 from a mid-zone entry
🧬 Ethan Rule: Update the map. Don’t defend it.
ETH has already changed the map by losing $2,000, so clinging to the old support story no longer helps.
Would you wait for the bounce into the sell zone, or stay away until the next clean rejection appears?
Trade active
Trade closed: target reached

🗺️ Ethan Crypto Club (free)
Ⓐ structure Ⓑ entry Ⓒ targets on alts & memes
Live map updates when price moves:
t.me/+Y-8MBg12Eg5hNzFl
NFA. Trade your own plan.
Ⓐ structure Ⓑ entry Ⓒ targets on alts & memes
Live map updates when price moves:
t.me/+Y-8MBg12Eg5hNzFl
NFA. Trade your own plan.
Related publications
Disclaimer
The information and publications are not meant to be, and do not constitute, financial, investment, trading, or other types of advice or recommendations supplied or endorsed by TradingView. Read more in the Terms of Use.
🗺️ Ethan Crypto Club (free)
Ⓐ structure Ⓑ entry Ⓒ targets on alts & memes
Live map updates when price moves:
t.me/+Y-8MBg12Eg5hNzFl
NFA. Trade your own plan.
Ⓐ structure Ⓑ entry Ⓒ targets on alts & memes
Live map updates when price moves:
t.me/+Y-8MBg12Eg5hNzFl
NFA. Trade your own plan.
Related publications
Disclaimer
The information and publications are not meant to be, and do not constitute, financial, investment, trading, or other types of advice or recommendations supplied or endorsed by TradingView. Read more in the Terms of Use.