
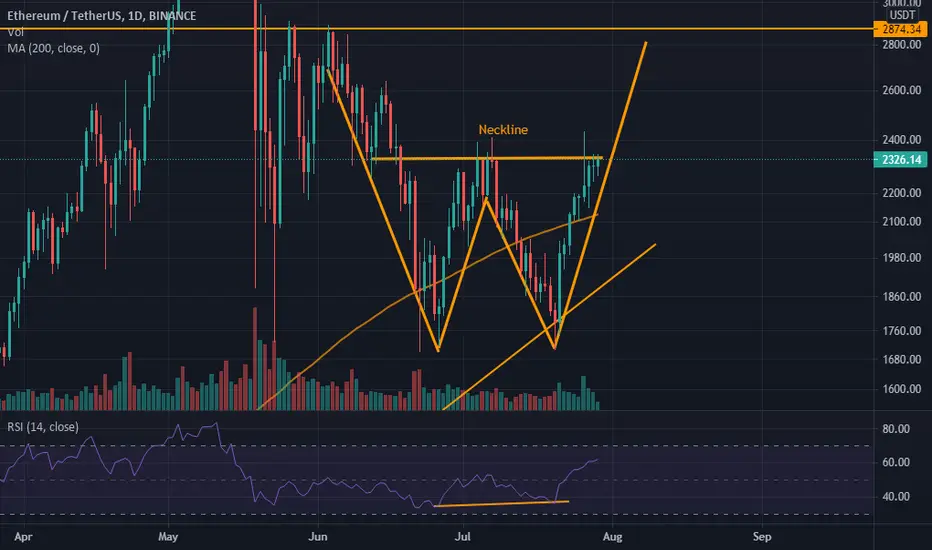
A double bottom is happening now on ETH chart. After it breaks the neckline then you can see the price target on chart.
I wanna mention that price has broken 200MA (Bullish).
I wanna mention that price has broken 200MA (Bullish).
Note
OK. Now if Ethereum breaks $2900 resistance then taking $4400 level won't be hard
Disclaimer
The information and publications are not meant to be, and do not constitute, financial, investment, trading, or other types of advice or recommendations supplied or endorsed by TradingView. Read more in the Terms of Use.
Disclaimer
The information and publications are not meant to be, and do not constitute, financial, investment, trading, or other types of advice or recommendations supplied or endorsed by TradingView. Read more in the Terms of Use.