
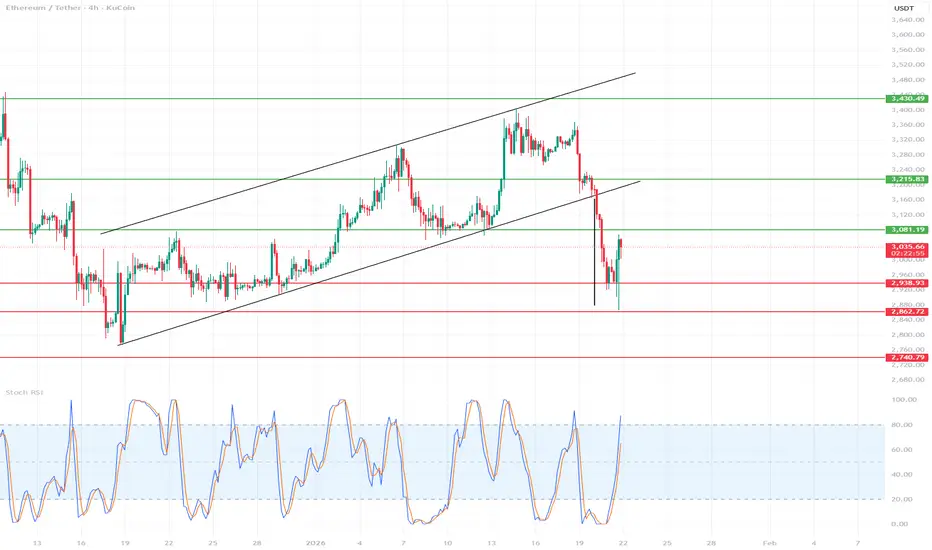
1️⃣ Market Structure (HTF – 4H)
We had a clear uptrend in the channel (black lines).
A breakout from the channel occurred at the bottom → this is a break of structure.
The decline was impulsive, without any major corrections → supply prevailed.
➡️ Medium-term bias: bearish/corrective
2️⃣ Key price levels
🔴 Supports
$2,938 – currently the closest technical support
$2,862 – a very important zone (strong reaction, long wick)
$2,740 – next HTF support (if the market collapses)
➡️ 2,862 = key decision level
Loss → high chance of a breakout to 2,740
🟢 Resistances
$3,081 – local resistance/flip after a breakout
$3,215 – former support, now resistance (ideal for shorts)
$3,430 – upper HTF resistance (only after a structure change)
3️⃣ Price Action (what we're seeing now)
After a strong dump, an impulsive downward wick appeared → Possible short-term relief (dead cat bounce).
The current bounce looks corrective, not impulsive.
Not yet:
higher low
4-hour candlestick closes above 3,081
➡️ This could still be just a pullback for further declines.
4️⃣ RSI Stochastic
RSI was heavily oversold → a technical bounce is normal.
Now a quick return to the upper regions → watch out for a bearish cross.
In downtrends, the Stoch RSI often:
Quickly reaches 80–100
and immediately reverses
➡️ RSI does not yet confirm a trend change
5️⃣ Scenarios
🟡 Scenario A – correction and further decline (more likely)
Bounce to 3,080–3,215
Rejection
Return to 2,860 → 2,740
📉 Short setup:
Reaction below 3,080 / 3,215
Weak volume, pin bar / bearish engulfing
🟢 Scenario B – return to growth (less likely)
Conditions:
4-hour close above 3,215
Hold as support
Only then target: 3,430
📈 Without this → longs are counter-trend
We had a clear uptrend in the channel (black lines).
A breakout from the channel occurred at the bottom → this is a break of structure.
The decline was impulsive, without any major corrections → supply prevailed.
➡️ Medium-term bias: bearish/corrective
2️⃣ Key price levels
🔴 Supports
$2,938 – currently the closest technical support
$2,862 – a very important zone (strong reaction, long wick)
$2,740 – next HTF support (if the market collapses)
➡️ 2,862 = key decision level
Loss → high chance of a breakout to 2,740
🟢 Resistances
$3,081 – local resistance/flip after a breakout
$3,215 – former support, now resistance (ideal for shorts)
$3,430 – upper HTF resistance (only after a structure change)
3️⃣ Price Action (what we're seeing now)
After a strong dump, an impulsive downward wick appeared → Possible short-term relief (dead cat bounce).
The current bounce looks corrective, not impulsive.
Not yet:
higher low
4-hour candlestick closes above 3,081
➡️ This could still be just a pullback for further declines.
4️⃣ RSI Stochastic
RSI was heavily oversold → a technical bounce is normal.
Now a quick return to the upper regions → watch out for a bearish cross.
In downtrends, the Stoch RSI often:
Quickly reaches 80–100
and immediately reverses
➡️ RSI does not yet confirm a trend change
5️⃣ Scenarios
🟡 Scenario A – correction and further decline (more likely)
Bounce to 3,080–3,215
Rejection
Return to 2,860 → 2,740
📉 Short setup:
Reaction below 3,080 / 3,215
Weak volume, pin bar / bearish engulfing
🟢 Scenario B – return to growth (less likely)
Conditions:
4-hour close above 3,215
Hold as support
Only then target: 3,430
📈 Without this → longs are counter-trend

Disclaimer
The information and publications are not meant to be, and do not constitute, financial, investment, trading, or other types of advice or recommendations supplied or endorsed by TradingView. Read more in the Terms of Use.
Disclaimer
The information and publications are not meant to be, and do not constitute, financial, investment, trading, or other types of advice or recommendations supplied or endorsed by TradingView. Read more in the Terms of Use.